EDIT: I am in the process of working out some data corrections to the PITCHf/x data, and I have updated this post with corrected pitch speed data.
Dave Cameron wrote a piece yesterday at Fangraphs about Justin Verlander’s fastball speed (hat tip to Tango). I love both Dave Cameron’s work and Fangraphs. Fangraphs is quickly becoming one of my very favorite sites on the InterWebs. However, something about Dave’s post today struck me a little funny, and I decided to investigate further.
Here are a couple excerpts from what Dave said about Verlander’s fastball:
One of the first things we noticed using that data this season was that Justin Verlander’s fastball disappeared in April. He was throwing 91-92 instead of his usual 94-95, and his performance suffered as a result.
For all the talk of guys learning how to pitch without their best stuff, Justin Verlander is clearly a better pitcher when he’s throwing 95 instead of 92.
It bugged me because I wasn’t sure it was true, either that Verlander’s fastball speed was improving as Dave said it was, or that there was a correlation between his fastball speed and performance.
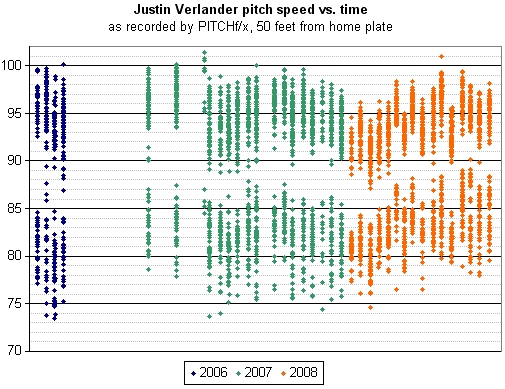
So I decided to dig into the PITCHf/x data for Verlander. Here’s what we see about his pitch speeds going back to the 2006 playoffs.

During the 2006 playoffs his average fastball speed was 94.7 mph. In 2007, PITCHf/x recorded his average fastball speed at 95.0, although the period from which we have most of our PITCHf/x data is after the All-Star break.
In 2008, his average fastball speed has been 94.1, and the trend matches fairly well with that which Dave describes seeing in the BIS data. However, I’m not sure I see as direct a correlation between fastball speed and performance for Verlander as Dave Cameron does.
To look a little deeper, I calculated Verlander’s average fastball speed for each of his starts for which we have PITCHf/x data. I decided to use the Bill James pitching game score as the measure of performance, and I grabbed that data from Baseball Reference. (Fangraphs! Baseball-Reference! Is there any better time in history to be a baseball fan?) Comparing the game score for each of Verlander’s starts to his average fastball speed, there appears to be a correlation, but a fairly weak one. (The R squared is 0.09.)

I guess you could say he hasn’t pitched any great games with a fastball in the 92-93 mph range, although having a faster fastball does not appear to be a firm guarantee of success. Mostly at this point, I am skeptical of our ability to ferret strong conclusions out of a data set where the sources of error are on the same magnitude as the effects we are trying to measure. My skepticism applies healthily to the BIS data as well as the PITCHf/x data.
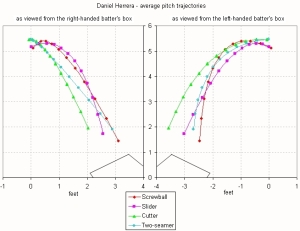
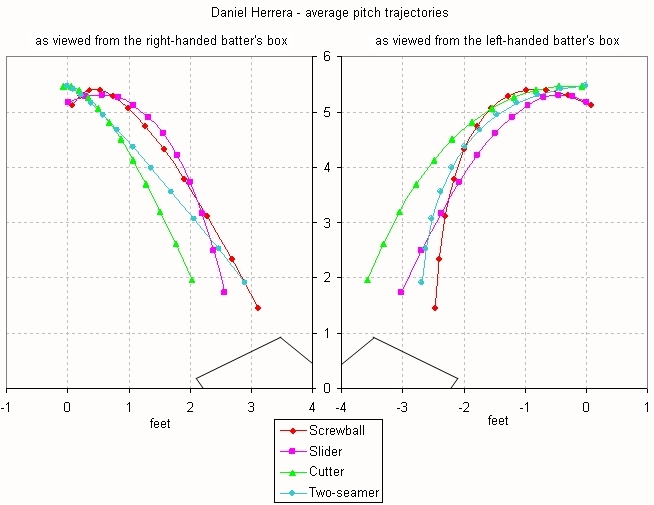
My article at Hardball Times on Danny Herrera’s screwball includes views of his pitch trajectories as seen from the right-handed and left-handed batter’s boxes.
I mentioned in the References section that I did some trigonometry to transform the coordinate system from plate view to batter’s box view.
Here is what I did.
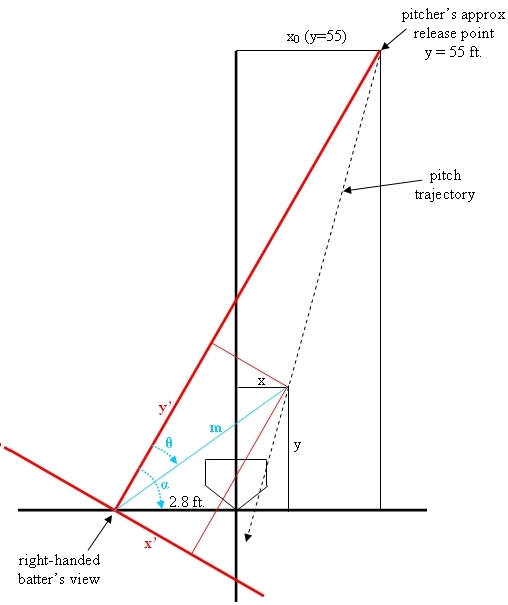
The pitch trajectory is shown as the dotted black line. Any point on the trajectory can be calculated using the initial position, velocity, and acceleration provided in the PITCHf/x data, along with the equations of motion. Only the x-y plane is shown above since no transformation was done to the z axis. The coordinates in the PITCHf/x coordinate space are x and y, shown in black.
The coordinates in the batter’s box view are x’ and y’, shown in red. The y-axis in the batter’s box view runs along a line from the batter’s head to the pitcher’s approximate release point (the average x value of his pitches at y = 55 feet). The x-axis in the batter’s box view is set perpendicular to this new y-axis.
The origin of the batter’s box view is offset 2.8 feet in the x direction from the origin in PITCHf/x coordinate space. I calculated 2.8 feet from the center of the plate as the approximate location of the batter’s head, based on a video frame capture in Marv White’s presentation at the PITCHf/x Summit. I chose not to offset the origin in the y direction for simplicity, although I also believe this does not introduce any significant inaccuracy. The batter’s head is typically within a foot or so of y=0.
First, I calculated the quantity m, the distance to the baseball, shown by the blue line. This distance m = sqrt ( y^2 + ( x + 2.8 ft)^2 ).
Next, I found the value of the angle alpha. The angle alpha = arctan ( 55 ft / ( x0 + 2.8 ft) ).
The angle (alpha – theta) = arctan ( y / ( x + 2.8 ft) ), which allows us to calculate the angle theta.
The angle theta = arctan ( 55 ft / ( x0 + 2.8 ft) ) – arctan ( y / ( x + 2.8 ft) ).
The batter’s box coordinates x’ and y’ can be found from the angle theta and the distance m. The new y’ = m * cos (theta), and the new x’ = m * sin (theta).
I am happy for you to use my method for batter’s view transformation if you provide attribution in the form of my name and/or a link to this website.
I have finally gotten around to publishing the 2008 updates to my pitch database parsing scripts.
There are new fields available in the 2008 data. The sv_id field is a date-time stamp of when the pitch was thrown, the pitch_type is the MLBAM algorithm’s best guess at the pitch type, and type_confidence is the confidence value associated with that guess. Starting in mid-May, there are also b_height and p_throws fields in the pitch element. I don’t currently use those fields. I get the pitcher throwing hand from the players’ information, and I don’t record the batter height at this time.
Here is my new database structure for 2008 with these fields added to the pitch table. You can download the new database parser script to use these fields. I have an additional script to update the pitches table with the ball-strike count at each pitch.
I used the time stamp data to look at how quickly pitchers work, and I wrote an article on this topic at The Hardball Times. Several people have asked or been curious about the pitch time data for all the pitchers on their time. Here are the data that I compiled as of June 5.
Angels
20.0 Ervin Santana
20.3 Joe Saunders
21.0 John Lackey
22.2 Jered Weaver
22.7 Dustin Moseley
23.4 Jon Garland
20.5 Chris Bootcheck
20.7 Darren O’Day
20.7 Scot Shields
20.8 Justin Speier
21.8 Jose Arredondo
23.2 Darren Oliver
24.1 Francisco Rodriguez
Astros
19.3 Roy Oswalt
19.6 Wandy Rodriguez
21.0 Jack Cassel
21.3 Shawn Chacon
22.2 Chris Sampson
24.4 Brian Moehler
24.7 Brandon Backe
20.9 Oscar Villarreal
21.1 Dave Borkowski
22.0 Doug Brocail
22.7 Tim Byrdak
23.2 Wesley Wright
24.4 Geoff Geary
28.0 Jose Valverde
Athletics
17.6 Joe Blanton
18.9 Rich Harden
20.0 Justin Duchscherer
20.6 Chad Gaudin
20.9 Gregory Smith
21.4 Dana Eveland
18.7 Dallas Braden
21.4 Keith Foulke
22.4 Joey Devine
22.5 Santiago Casilla
22.8 Huston Street
23.4 Andrew Brown
25.3 Alan Embree
Blue Jays
19.9 Jesse Litsch
22.1 Roy Halladay
22.5 Shaun Marcum
24.6 Dustin McGowan
24.7 A.J. Burnett
19.5 Jesse Carlson
21.3 B.J. Ryan
22.8 Shawn Camp
24.0 Brian Tallet
24.4 Jeremy Accardo
26.0 Scott Downs
26.6 Jason Frasor
Braves
19.3 Chuck James
19.5 Jo-Jo Reyes
20.1 Tom Glavine
22.1 John Smoltz
22.1 Jair Jurrjens
22.5 Tim Hudson
21.1 Jorge Campillo
21.4 Jeff Bennett
22.1 Manny Acosta
22.5 Blaine Boyer
22.8 Will Ohman
23.0 Royce Ring
25.7 Chris Resop
Brewers
18.4 Ben Sheets
20.9 David Bush
22.0 Yovani Gallardo
22.2 Manny Parra
22.4 Carlos Villanueva
23.3 Jeff Suppan
21.0 Mitch Stetter
21.3 Brian Shouse
22.9 David Riske
23.4 Seth McClung
23.6 Salomon Torres
25.9 Eric Gagne
26.4 Guillermo Mota
Cardinals
19.9 Kyle Lohse
20.2 Braden Looper
20.7 Todd Wellemeyer
21.2 Brad Thompson
21.5 Joel Pineiro
22.0 Adam Wainwright
20.0 Kyle McClellan
20.7 Anthony Reyes
21.1 Michael Parisi
22.7 Randy Flores
23.0 Ryan Franklin
25.0 Ron Villone
25.4 Russ Springer
27.4 Jason Isringhausen
Cubs
18.8 Rich Hill
18.9 Sean Gallagher
19.0 Carlos Zambrano
20.1 Ryan Dempster
21.3 Jason Marquis
22.1 Ted Lilly
17.8 Jon Lieber
20.1 Carlos Marmol
20.7 Kerry Wood
21.5 Mike Wuertz
24.9 Kevin Hart
26.5 Bob Howry
Diamondbacks
20.9 Randy Johnson
21.5 Brandon Webb
21.7 Dan Haren
22.2 Micah Owings
22.6 Max Scherzer
23.2 Doug Davis
24.5 Edgar Gonzalez
20.5 Doug Slaten
24.1 Brandon Lyon
24.1 Brandon Medders
25.2 Tony Pena
25.3 Chad Qualls
25.6 Juan Cruz
Dodgers
18.4 Esteban Loaiza
18.6 Derek Lowe
20.0 Clayton Kershaw
21.9 Brad Penny
22.6 Chad Billingsley
23.4 Hiroki Kuroda
19.9 Cory Wade
22.5 Scott Proctor
22.8 Chan Ho Park
24.2 Takashi Saito
25.5 Hong-Chih Kuo
26.0 Jonathan Broxton
26.6 Joe Beimel
Giants
19.7 Matt Cain
20.4 Tim Lincecum
21.4 Barry Zito
21.7 Pat Misch
22.0 Jonathan Sanchez
22.4 Kevin Correia
21.9 Billy Sadler
22.6 Merkin Valdez
23.6 Brian Wilson
23.7 Keiichi Yabu
24.1 Brad Hennessey
25.5 Vinnie Chulk
26.2 Jack Taschner
27.0 Tyler Walker
Indians
20.2 Aaron Laffey
21.4 Jake Westbrook
21.5 Jeremy Sowers
21.7 Paul Byrd
21.8 Cliff Lee
23.3 Fausto Carmona
23.7 C.C. Sabathia
20.7 Jorge Julio
21.6 Jensen Lewis
24.2 Craig Breslow
26.9 Masa Kobayashi
29.1 Rafael Perez
32.0 Rafael Betancourt
Mariners
19.4 Carlos Silva
19.9 Jarrod Washburn
21.3 Felix Hernandez
23.2 Miguel Batista
24.5 Erik Bedard
17.9 R.A. Dickey
20.0 Ryan Rowland-Smith
21.9 Sean Green
22.2 Cha Seung Baek
22.4 Mark Lowe
22.7 Roy Corcoran
24.2 Brandon Morrow
27.9 J.J. Putz
Marlins
19.0 Scott Olsen
20.4 Andrew Miller
21.2 Burke Badenhop
22.4 Mark Hendrickson
23.7 Ricky Nolasco
20.4 Justin Miller
21.2 Doug Waechter
21.4 Kevin Gregg
22.8 Renyel Pinto
24.1 Logan Kensing
24.2 Matt Lindstrom
25.5 Taylor Tankersley
Mets
20.3 John Maine
20.8 Nelson Figueroa
22.4 Mike Pelfrey
22.7 Oliver Perez
22.7 Johan Santana
23.8 Claudio Vargas
21.3 Pedro Feliciano
21.7 Duaner Sanchez
22.8 Scott Schoeneweis
22.8 Joe Smith
22.9 Billy Wagner
23.5 Aaron Heilman
25.0 Jorge Sosa
Nationals
17.7 Jason Bergmann
19.6 Shawn Hill
20.0 John Lannan
20.2 Tim Redding
20.5 Matt Chico
22.9 Odalis Perez
20.5 Joel Hanrahan
21.8 Saul Rivera
21.9 Jon Rauch
22.3 Luis Ayala
23.8 Jesus Colome
Orioles
19.9 Adam Loewen
20.7 Jeremy Guthrie
20.9 Daniel Cabrera
22.0 Garrett Olson
22.4 Brian Burres
24.1 Steve Trachsel
21.3 Randor Bierd
22.0 Lance Cormier
22.1 Matt Albers
22.4 Jim Johnson
22.5 George Sherrill
23.7 Dennis Sarfate
24.0 Jamie Walker
24.6 Chad Bradford
Padres
19.5 Randy Wolf
19.6 Jake Peavy
20.2 Shawn Estes
20.7 Justin Germano
21.0 Greg Maddux
21.3 Chris Young
23.1 Wil Ledezma
28.1 Josh Banks
17.2 Glendon Rusch
19.6 Cla Meredith
20.4 Joe Thatcher
20.9 Mike Adams
23.1 Trevor Hoffman
24.0 Heath Bell
24.8 Bryan Corey
Phillies
19.2 Cole Hamels
19.8 Brett Myers
20.2 Adam Eaton
20.3 Jamie Moyer
21.2 Kyle Kendrick
19.1 Clay Condrey
19.6 Chad Durbin
21.2 Brad Lidge
22.4 Ryan Madson
25.1 Rudy Seanez
25.2 J.C. Romero
25.4 Tom Gordon
Pirates
20.0 Zach Duke
20.9 Phil Dumatrait
20.9 Matt Morris
21.0 Tom Gorzelanny
21.5 Paul Maholm
24.1 Ian Snell
20.2 John Grabow
21.5 Damaso Marte
21.5 Sean Burnett
22.5 Franquelis Osoria
22.8 Matt Capps
22.8 Evan Meek
26.0 Tyler Yates
Rangers
19.5 Sidney Ponson
21.3 Scott Feldman
21.3 Jason Jennings
21.4 Kason Gabbard
23.0 Douglas Mathis
23.4 Kevin Millwood
24.2 Vicente Padilla
19.5 Eddie Guardado
22.8 C.J. Wilson
23.7 Josh Rupe
24.1 Jamey Wright
24.6 Franklyn German
24.9 Frank Francisco
26.2 Joaquin Benoit
Rays
19.7 Andy Sonnanstine
22.5 James Shields
22.5 Edwin Jackson
22.6 Jason Hammel
22.8 Scott Kazmir
24.2 Matt Garza
21.7 Trever Miller
23.4 J.P. Howell
23.6 Gary Glover
25.8 Al Reyes
26.6 Troy Percival
26.9 Scott Dohmann
27.3 Dan Wheeler
Red Sox
18.9 Justin Masterson
19.3 Tim Wakefield
23.2 Bartolo Colon
23.5 Jon Lester
24.3 Daisuke Matsuzaka
26.0 Josh Beckett
26.5 Clay Buchholz
23.7 Craig Hansen
23.8 David Aardsma
25.5 Julian Tavarez
26.3 Mike Timlin
26.3 Manny Delcarmen
26.5 Javier Lopez
27.5 Hideki Okajima
28.4 Jonathan Papelbon
Reds
20.0 Bronson Arroyo
20.0 Matt Belisle
20.7 Johnny Cueto
20.9 Josh Fogg
21.1 Aaron Harang
23.2 Edinson Volquez
19.6 Mike Lincoln
19.7 Kent Mercker
20.6 Francisco Cordero
21.3 Jeremy Affeldt
21.4 Todd Coffey
21.9 Bill Bray
22.2 David Weathers
22.8 Jared Burton
Rockies
20.7 Franklin Morales
21.0 Mark Redman
21.1 Aaron Cook
21.6 Jeff Francis
21.9 Ubaldo Jimenez
23.3 Jorge De La Rosa
23.8 Gregory Reynolds
21.0 Alberto Arias
23.7 Taylor Buchholz
23.8 Brian Fuentes
24.9 Jason Grilli
25.3 Ryan Speier
25.7 Manny Corpas
25.7 Matt Herges
26.3 Kip Wells
Royals
20.0 Brian Bannister
20.3 John Bale
21.4 Zack Greinke
22.0 Brett Tomko
22.7 Gil Meche
23.0 Luke Hochevar
23.4 Kyle Davies
21.0 Joakim Soria
22.5 Ron Mahay
23.4 Yasuhiko Yabuta
24.6 Ramon Ramirez
26.0 Jimmy Gobble
27.1 Leo Nunez
29.0 Joel Peralta
Tigers
20.4 Justin Verlander
20.9 Nate Robertson
21.1 Dontrelle Willis
23.2 Armando Galarraga
24.2 Kenny Rogers
24.7 Jeremy Bonderman
21.0 Todd Jones
22.1 Aquilino Lopez
22.7 Zach Miner
24.5 Freddy Dolsi
25.9 Francisco Cruceta
26.8 Bobby Seay
27.6 Denny Bautista
Twins
20.2 Glen Perkins
21.3 Kevin Slowey
21.4 Nick Blackburn
21.8 Francisco Liriano
22.1 Livan Hernandez
23.2 Boof Bonser
24.3 Scott Baker
22.1 Brian Bass
23.2 Matt Guerrier
23.4 Pat Neshek
24.4 Juan Rincon
24.9 Dennys Reyes
26.5 Jesse Crain
26.8 Joe Nathan
White Sox
17.2 Mark Buehrle
20.5 John Danks
21.6 Gavin Floyd
22.8 Jose Contreras
22.9 Javier Vazquez
20.3 Scott Linebrink
20.7 Matt Thornton
20.8 Nick Masset
21.4 Boone Logan
22.7 Octavio Dotel
23.9 Bobby Jenks
Yankees
21.3 Darrell Rasner
22.1 Andy Pettitte
24.0 Ian Kennedy
25.1 Phil Hughes
25.7 Mike Mussina
26.6 Chien-Ming Wang
22.7 Mariano Rivera
22.8 Kyle Farnsworth
24.4 Jose Veras
25.0 Edwar Ramirez
25.1 Joba Chamberlain
25.5 Jonathan Albaladejo
25.8 Brian Bruney
26.3 Ross Ohlendorf
26.7 LaTroy Hawkins


 Fast Balls RSS
You must be logged in to post a comment.