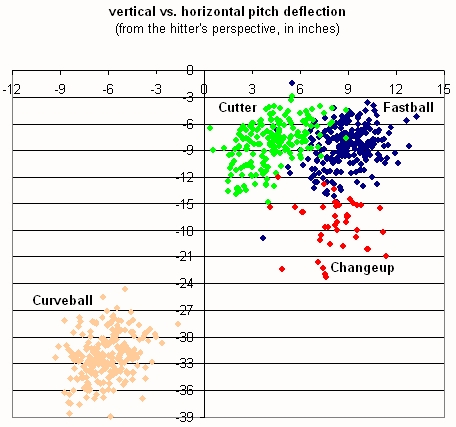
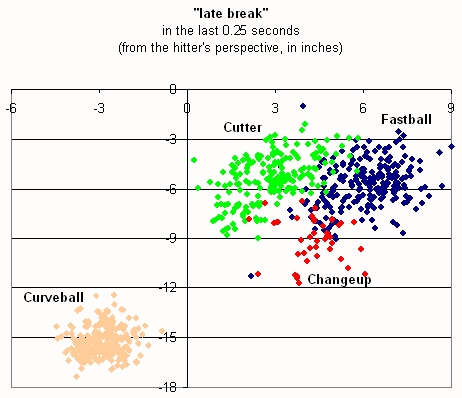
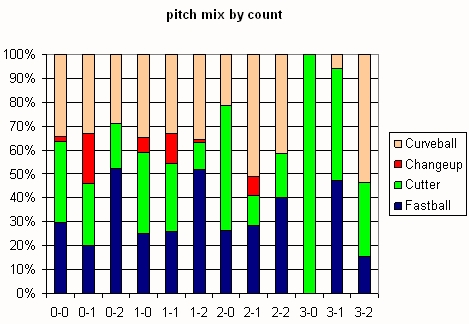
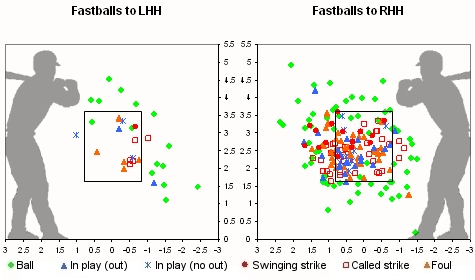
When David Price was chosen by the Tampa Bay Rays with the first overall pick of the 2007 amateur draft, it probably would not have surprised fans to find him as one of the best pitchers in the American League in the 2010 season.  In between, however, has been an interesting journey with a number of adjustments for Price along the way.

Price made a rapid ascent through the minor leagues in 2008, dominating High-A Vero Beach and Double-A Montgomery with sub-2.00 ERAs, 92 strikeouts in 91.2 innings, and a sparkling 11-0 win-loss record.  He was promoted to Triple-A Durham in August 2008 and held his own with a 4.50 ERA and 17 strikeouts in 18 innings.  He was called up to the big leagues and debuted with the Rays in a pennant race, pitching mostly out of the bullpen in September.  He pitched in three games in the American League Championship Series and two games in the World Series, striking out eight in 5.2 innings and acquitting himself well against October competition.

2009, however, was a year of struggles for Price.  He was sent back to the minors to begin the season, and after he was called up in late May, he posted a 5.60 ERA through his first 11 starts, failing to finish the fifth inning in five of those games.  Though he had posted 54 strikeouts in 53 innings, he had also given up 33 walks and 11 home runs.  He finished the remainder of the season on a stronger note, recording a 3.58 ERA over his final 12 starts, allowing only 6 home runs and 21 walks in 75.1 innings, but also cutting his strikeouts to 48 over that time frame.

In 2010, David Price emerged as the dominant starter people expected when he was drafted.  He finished third in the American League with a 2.72 ERA and boasted a splendid 19-6 win-loss record.  His peripherals were solid, with 188 strikeouts in 208.2 innings against 170 hits, 79 walks, and 15 home runs allowed.

Let’s take a look at the pitches that Price throws and how his repertoire has evolved during his tenure with the Rays.

Evolution of his repertoire

As you will see, classifying Price’s pitches can be a bit of a challenge when he’s frequently changing what pitches are in his repertoire.  However, I’ll go out on a limb and say that Price has used six pitch types in the major leagues: a four-seam fastball, slider, curveball, and three variations on a sinking pitch which I have identified as a two-seam fastball, split-finger fastball, and changeup.

I’ll explain the varieties of sinkers and changeups in a moment, as well as his journey from one pitch type to another.  Let’s start by talking about what Price threw when he broke into the majors in 2008, mostly pitching out of the bullpen.

For those of you not familiar with my previous writing, I enjoy analyzing the detailed pitch data that has been collected on pitchers for the past few years using the PITCHf/x camera systems that are installed in all 30 major league stadiums.  PITCHf/x tracks the speed and trajectory of nearly every pitch thrown in major league games, and the information is available for download from Major League Baseball’s Gameday website.  I have created a database of this pitch information and use it to analyze pitchers.  A number of other analysts have done similar work, including Josh Kalk, who published at the Hardball Times before being hired by the Rays in 2009.

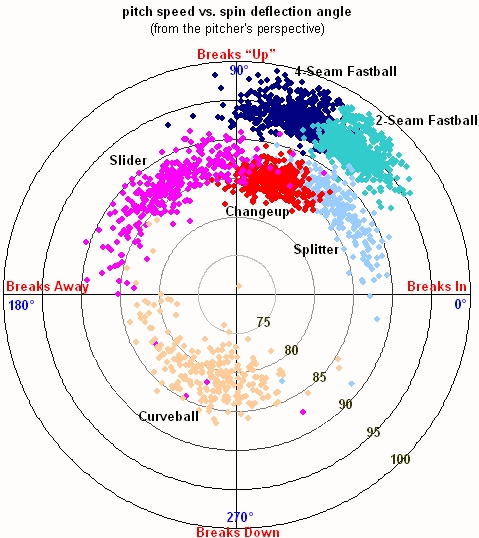
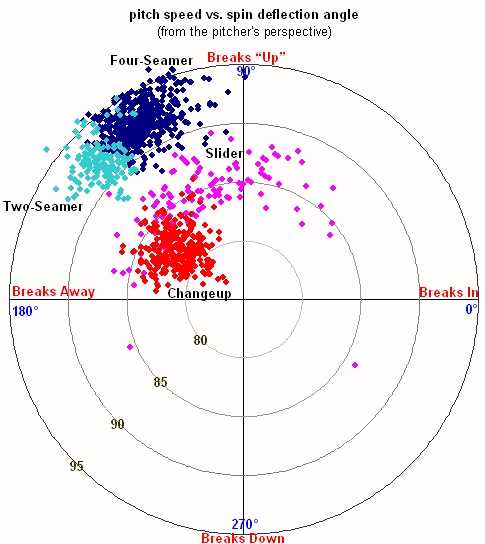
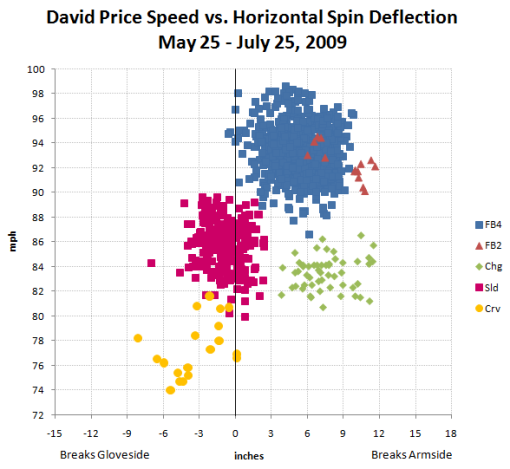
Let’s look at what the PITCHf/x data show us about the pitch speed and spin movement of the pitches he has thrown.  We’ll go through each of the stages of the evolution of Price’s pitch repertoire, beginning with 2008.

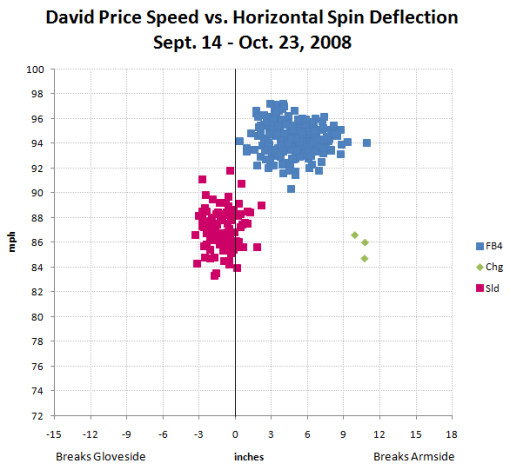
David Price was basically a two-pitch pitcher as a reliever in 2008.  He threw a 94-mph four-seam fastball two thirds of the time, and the other third of the time he threw an 87-mph slider.  He also showed a changeup, but it was not a regular part of his repertoire out of the bullpen.

When he returned to the majors in May 2009 as a starting pitcher, he threw his four-seam fastball slightly slower, averaging 93.4 mph, but it was still his main pitch.  He expanded his off-speed offerings to right-handed hitters, adding an occasional changeup and a rare curveball or two-seam fastball.  You’ll recall that he was not especially effective during this period, and he struggled with his control.
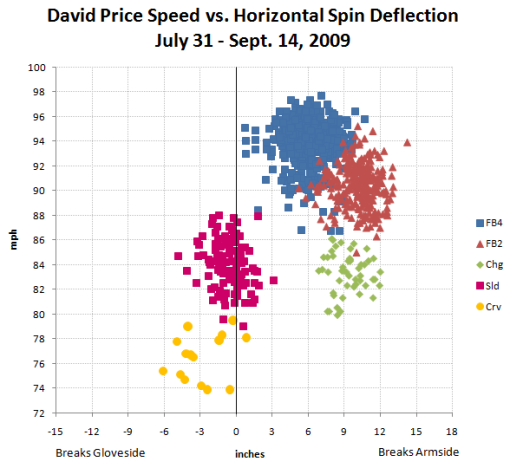
In the second half of 2009, Price added a 90-91 mph two-seam fastball and cut back on his slider usage.  He threw the two-seam fastball almost exclusively to right-handed hitters, and used it almost as often to them as he did the four-seam fastball.
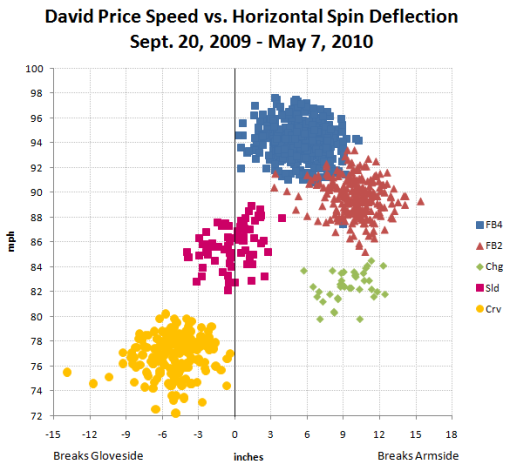
In his last three starts of 2009 and continuing into 2010, Price began to feature his curveball much more prominently and nearly abandoned his slider.  He also increased the speed differential between his four-seam fastball and two-seam fastball, as he threw the sinking fastball only 89-90 mph.
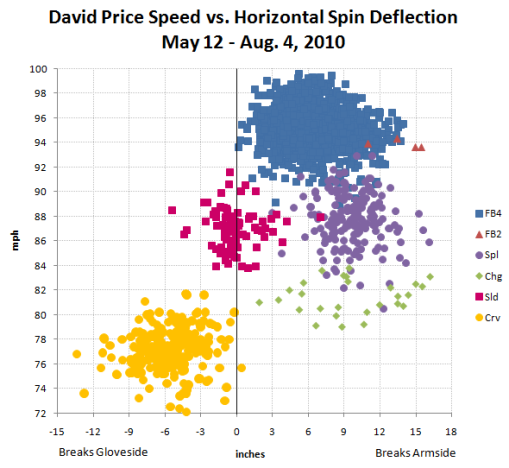
From May through August of 2010, the evolution of Price’s two-seam fastball continued.  He decreased the speed of the pitch even further to an average of 87 mph, such that it could probably best be described as a split-finger fastball.  At the same time, he upped his average four-seam fastball speed to 95 mph.
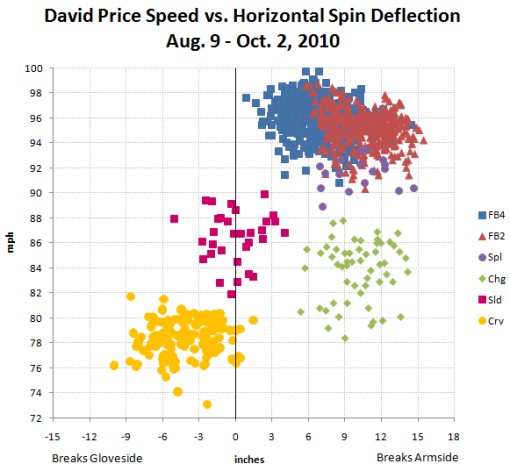
Finally, in August and September, Price largely abandoned the splitter (or whatever you want to call the high-80s sinking pitch) and replaced it with a harder two-seam fastball, thrown nearly as hard as his now 96-mph four-seam fastball.

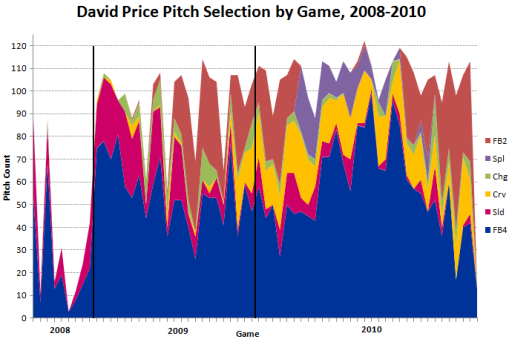
We’ve examined each of the major phases of David Price’s pitch repertoire development. Let’s view the same thing a different way by looking at his pitch selection by game throughout his career.

We see that Price began his career as a four-seam fastball and slider pitcher, then added a two-seam fastball, then a curveball. Next, he replaced the two-seam fastball with a splitter, then went back to the two-seam fastball.  Toward the end of 2010, he increasingly favored the two-seam fastball over the four-seam fastball.

Pitch repertoire description

Let’s talk a little more about each of his pitch types.

First, the four-seam fastball.  Price has gained speed on his four-seamer in 2010.  In 2008, mostly in relief, his heat was measured at an average of 94.3 mph by PITCHf/x.  In 2009, it was measured at 93.5 mph; however, the Tampa Bay PITCHf/x system was recording speeds about 0.8 mph too slow that year.  That would imply Price’s real 2009 average fastball was more like 93.9 mph, assuming a roughly equal number of pitches at home and on the road.  In 2010, his average four-seamer was recorded at 95.2 mph.  The Tampa Bay PITCHf/x system was still recording speeds about 0.8 mph too slow until mid June; after that it was fairly well calibrated for speed.  The calibration adjustments to the PITCHf/x data give us an average four-seam fastball speed of about 95.4 mph for the 2010 season, or 1.5 mph faster than it was in 2009.

There has been some talk about Price progressively increasing his fastball speed during the 2010 season.  I believe this perception was mostly, but not totally, an artifact of the PITCHf/x calibration adjustment in mid June.  In August and September of 2010, his four-seam fastball averaged about 95.9 mph.

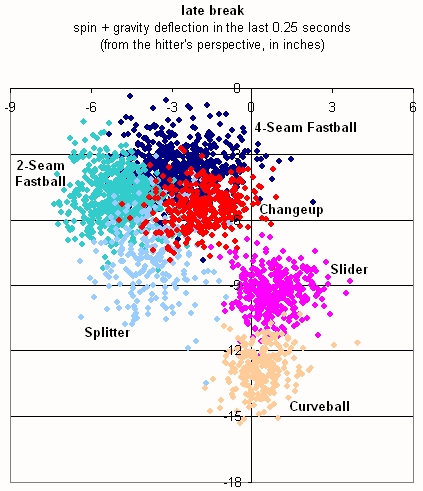
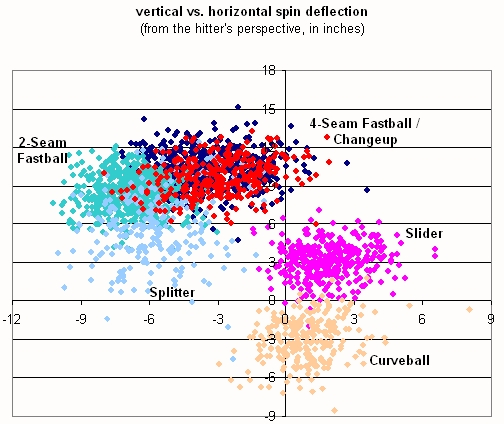
Price gets about eight inches of hop and seven inches of tail on his four-seam fastball.  That’s pretty typical for a major-league four-seamer.  He heavily relies on the pitch to left-handed batters, throwing it 75 percent of the time to them during 2010, whereas to righties he throws it only 49 percent of the time and mixes in the two-seam fastball.  The four-seamer is his primary strikeout pitch, generating 85 percent of his strikeouts of lefty batters in 2010 and 67 percent of his strikeouts of righties.  Price uses a classic four-seam grip, which you can see here.

We discussed earlier that David Price debuted a two-seam fastball in the second half of the 2009 season.  To recap, it was a pitch he threw 90-91 mph, about three mph slower than his four-seamer.  In 2010, he switched to a slower version that I’ve called a split-finger fastball before returning to a much harder two-seam fastball in August and September.  This new two-seam fastball averaged 95.1 mph, or within one mph of his four-seam fastball.  He gets about six inches of hop and 11 inches of tail on his two-seam fastball, which is about four or five inches of movement relative to his four-seamer.  In August and September, Price used the two-seamer only six percent of the time to left-handed batters but 37 percent of the time to right-handed batters.  You can see his two-seam fastball grip here and here.

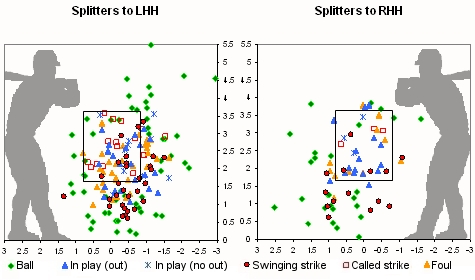
Price’s split-finger fastball, as I’m calling it here, is a slower version of his two-seam fastball that existed primarily from May 12 to August 4, 2010.  His average speed on this pitch was about 87.4 mph, or almost eight mph slower than his four-seam fastball.  That’s almost a changeup speed differential, and I might have called it a changeup were it not for an even slower offspeed pitch type thrown by Price, which we will discuss in a moment.  His splitter gets about five inches of hop and nine inches of tail, fairly similar to his two-seamer.  During the time period where this was his main sinking offspeed pitch, May to July, he threw it 15 percent of the time to right-handed batters and rarely, if ever, to lefties. (I counted two such instances.) I’ve looked for game photos of his splitter grip from games in the May 12 to August 4 time frame, but so far I’ve had no luck finding any.  I’d guess his splitter grip is pretty similar to his two-seamer grip, with the variation coming in how tightly he grips the ball into his palm rather than from major changes in seam orientation.

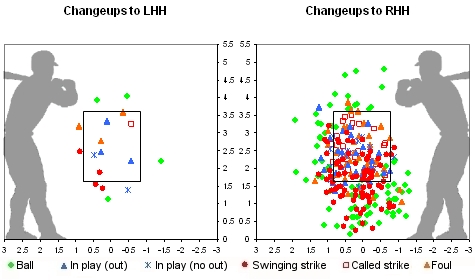
As mentioned previously, Price has another slower sinking off-speed pitch.  I’ve called this pitch type a changeup.  His changeup averages about 83 mph, or 12 mph slower than his four-seam fastball.  He gets about seven inches of hop and 10 inches of tail on his changeup, very similar spin movement to his two-seam fastball.  He has thrown the pitch exclusively to right-handed opponents, about four percent of the time during the 2010 season.  I’ve not been able to find a game photo that I can conclusively identify as a changeup grip, but this one looks suspiciously like a circle change to me, though it wasn’t taken from the best angle for grip identification.

Coming up through the minors, Price’s slider drew high praise, and it was his main secondary pitch at the end of the 2008 season.  However, we’ve seen a lot less of the slider since he developed the curveball toward the end of 2009.  He throws the slider about 86-87 mph, with very little spin movement.  When it was his main breaking ball in 2008-2009, he threw it equally to righthanders and lefthanders.  In 2010, he used it mostly to lefties (12 percent of the time) and rarely to righties (three percent of the time), preferring instead to use the curveball against right-handed batters.  You can see a photo of his slider grip here.

There is some indication in his last couple starts, September 23 and September 28, 2010, that Price might be evolving his now seldom-used slider into a cutter.  The slider was thrown a little harder with a little more hop in those two games.  It’s a very small sample size, a total of five pitches, but it was enough to pique my curiosity, and it’s something I’ll be paying attention to in the playoffs.

Price’s favorite breaking pitch is now a curveball. He throws the curveball at about 78 mph on average, and he gets five inches of cut and eight inches of drop due to spin.  If you include the effect of gravity, his curveball drops about 2.5-3 feet. In 2010, he used the curve 11 percent of the time to left-handed batters and 17 percent of the time to right-handed batters.  He uses a spike curveball grip that you can see here.

Pitch mix

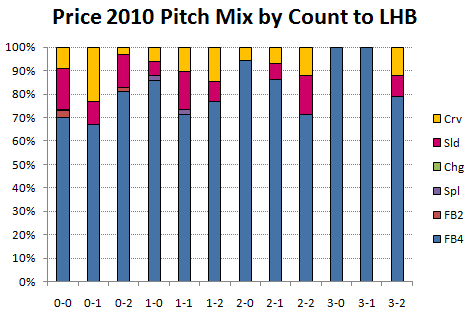
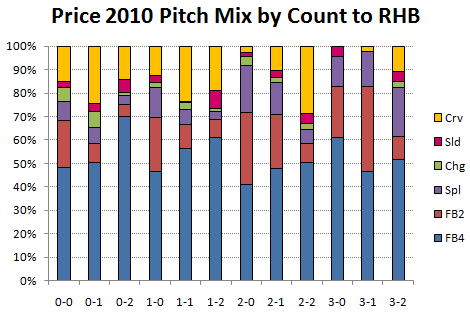
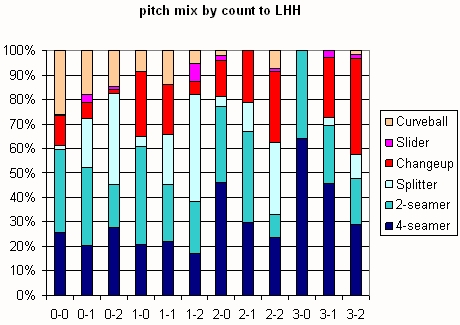
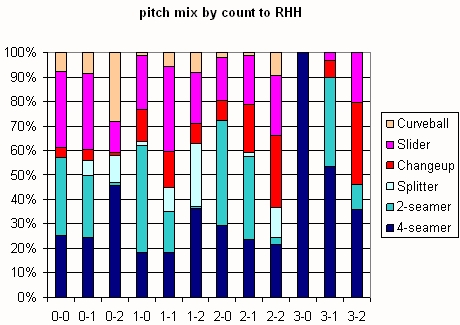
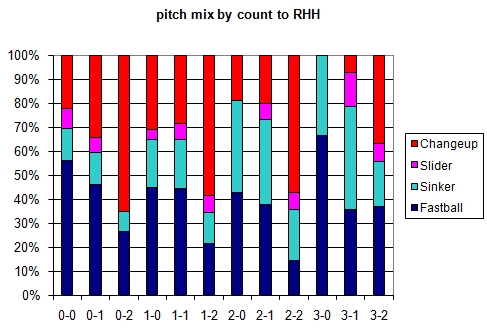
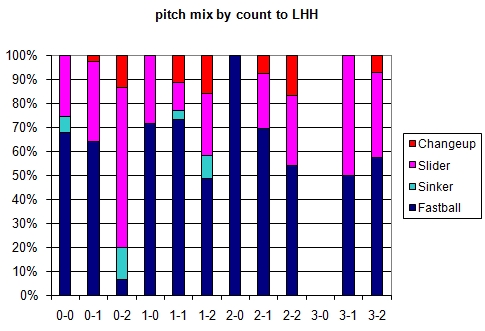
We’ve looked at some changes in Price’s pitch repertoire and examined some of how he uses each of his pitches.  Let’s also look at how he mixes his pitch types in different ball-strike counts.  Below, I show his pitch mix for 2010, split out by batter handedness.


To left-handed batters, Price uses mostly his four-seam fastball.  This is especially true when he falls behind in the count; lefties will see the four-seamer 87% of the time in this case.  When he is even or ahead in the count, he’s a little more likely to throw a breaking pitch (26% of the time).

Price uses his off-speed and sinking pitches more freely with right-handed opponents, though he still favors his four-seam fastball as a strikeout pitch on 0-2 (70% of the time).   He throws his curveball most often (19% of the time) to righties when even or ahead in the count, and his splitter and two-seam fastball when he gets behind in the count.

Pitch results

What kind of results did Price get with each of his pitch types in 2010?

Pitch Number Ball CS Foul SS InPlay BACON BABIP SLG HR Strk% Con%
FB4 1841 0.34 0.17 0.23 0.11 0.15 0.319 0.299 0.500 0.028 66% 77%
FB2 507 0.33 0.15 0.20 0.09 0.22 0.219 0.205 0.325 0.018 67% 82%
Spl 208 0.34 0.17 0.15 0.09 0.25 0.327 0.300 0.481 0.038 66% 81%
Chg 105 0.33 0.18 0.19 0.07 0.23 0.208 0.208 0.292 0.000 67% 86%
Sld 172 0.35 0.17 0.16 0.10 0.22 0.135 0.086 0.361 0.054 65% 79%
Crv 521 0.39 0.22 0.17 0.07 0.15 0.342 0.333 0.468 0.013 61% 81%

Price has thrown all six of his pitch types for strikes this year.  The four-seam fastball and two-seam fastball generated impressive whiff rates, 11% and 9% respectively, as compared to 7% and 6% major-league average.  His off-speed and breaking stuff, however, was not terribly impressive in that regard.  He had some pretty low batting averages allowed on balls in play (BABIP) for the two-seam fastball, the changeup, and the slider.  I looked a little deeper into this but did not find any patterns that suggested this was likely to be a persistent trend.  It’s possible I missed something that data from additional seasons may reveal more clearly.

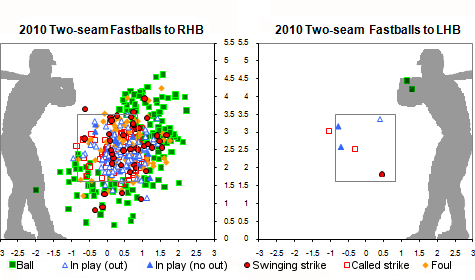
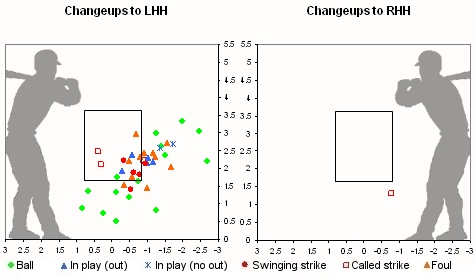
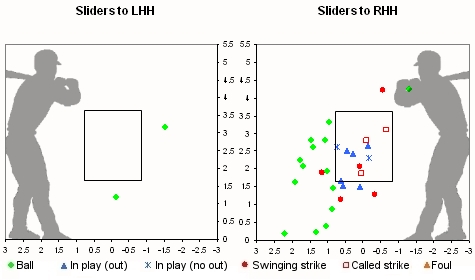
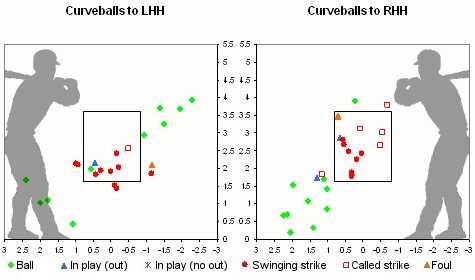
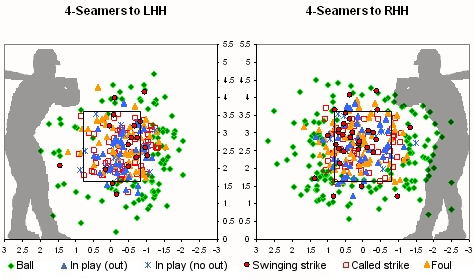
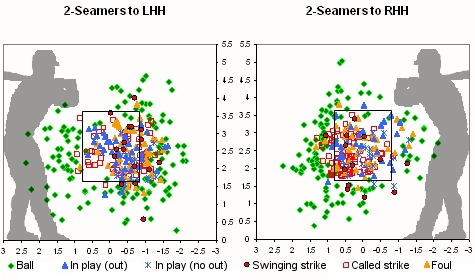
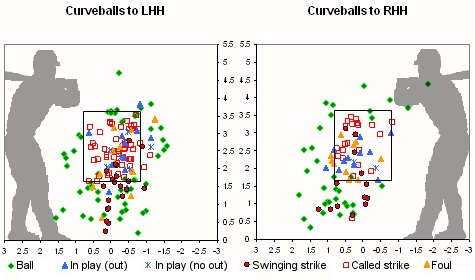
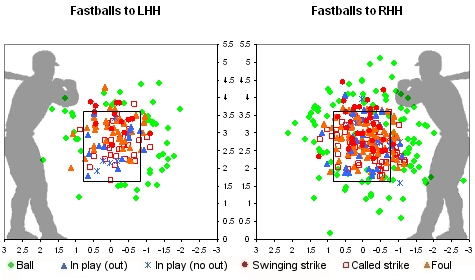
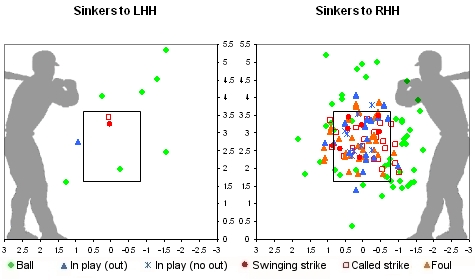
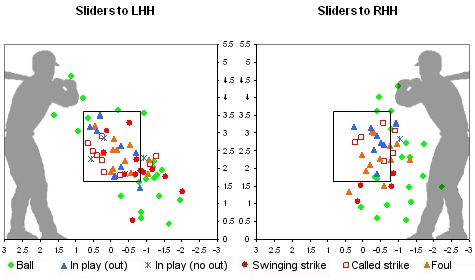
Let’s look now at where he locates his pitches to right-handed and left-handed batters. Strike-zone location charts are shown from the perspective of the catcher. The location of a pitch is indicated where it crossed the front plane of home plate.
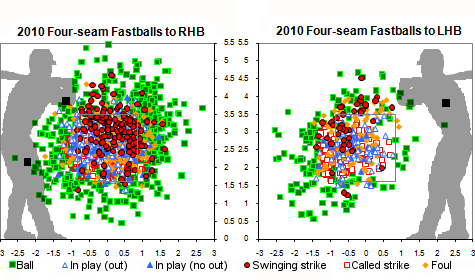
The first thing that is obvious from this graph is that David Price faces many more right-handed batters than left-handed batters.  Price has faced 77 percent right-handed batters; this is fairly typical for a left-handed starting pitcher.  Against righthanders, Price throws his four-seamer both inside and outside.  He’s very successful at getting swinging strikes when he gets the ball up and away within the strike zone.  Against lefthanders, he keeps the four-seamer away, and he gets quite a few called strikes where the umpires typically expand the outside edge of the zone to lefty batters.
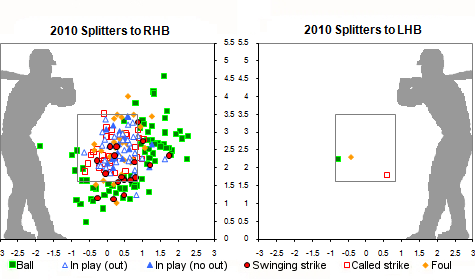
Price pitched with a similar pattern with all of his sinking pitches: the two-seam fastball, the split-finger fastball, and the changeup (as I have labeled them), so I’ll discuss them together.  He rarely throws any of the them to left-handed opponents.  To right-handed batters, he kept them on the outside edge.  He does well at throwing them for strikes, and the two-seamer seems to be the best of the three at fooling opponents into swinging and missing.
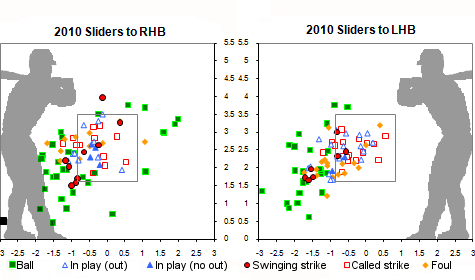
As already discussed, Price cut back on his slider usage in 2010.  When he did use it, he kept it away from lefties and brought it inside to righties, which is a typical approach for a left-handed pitcher.  Price was able to throw the slider for strikes, but otherwise it was fairly unremarkable, generating below-average numbers of whiffs.
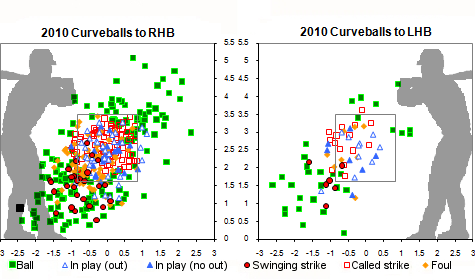
On the other hand, Price used the curveball much more like a typical breaking pitch, inducing swings and misses on pitches down and out of the zone, though again, his whiff rate on the curve was below average when compared to the league.  To right-handed batters, he mostly kept the curveball across the middle of the plate, and he was able to keep it in zone at a slightly above average rate (62 percent vs. league average of 57 percent).  Against left-handed batters, he moved the curveball more toward the outside edge, and consequently, his curveball strike rate was lower to lefties (57 percent).

Conclusions

It has been interesting to watch David Price develop into the ace of the Rays’ pitching staff.  It has been fascinating for me to dive into how he accomplished that and to learn about the evolution of his repertoire across seasons.  It’s rare that a pitcher is that willing to continuously experiment, adapt, and evolve.

He has a dominant 95-96 mph four-seam fastball that serves him well against left-handed batters and a four-seamer/two-seamer pairing that has helped him improve against right-handers in 2010.  His breaking pitches are average offerings that fill out a solid repertoire.  Though his performance on batted balls going forward may not be expected to be as good as it was in 2010, his stuff certainly seems to support his ability to carry the mantle of staff ace in the future.
Note: This article was originally published at the Statistically Speaking blog at MVN.com on February 28, 2008.  Since the MVN.com site is defunct and its articles are no longer available on the web, I am re-publishing the article here.

 In Part 1 of this series, we examined Brian Bannister’s suggestions for why he has been able to beat the league BABIP. He indicated that it was probably due to pitching more often in favorable pitcher’s counts and inducing balls in play with two strikes, when the hitter is against the ropes. However, the evidence didn’t show much advantage for Bannister. We noted that he did pitch a little more often in favorable counts, but this led to him avoiding walks more than anything; it had little salutary effect on his BABIP.

In Part 2 of this series, we learned about the pitches that Bannister threw during 2007 and how he used them. We saw that the fastball and curveball were good pitches against right-handed hitters, and the slider was a good pitch against left-handed hitters.

Part 1
Part 2
Part 3

In this final part of the series, we’re going to marry those two approaches to see if we can uncover any patterns that might explain Bannister’s BABIP performance. In this portion, I’m not concentrating so much on evaluating Bannister’s own statements, as I did on Part 1. Rather, I’m thinking more about what we can expect from Bannister in the future. I’m also interested in investigating techniques that could prove useful for evaluating DIPS theory on a component basis as we accumulate more PITCHf/x data in the coming seasons.
Should we expect Bannister to maintain any of his BABIP edge and thus his 3.87 ERA from 2007? Or are the projection systems like PECOTA (subscribers only) and CHONE more reasonable when they project an ERA of 5.19 or 4.74?

(more…)

Note: This article was originally published at the Statistically Speaking blog at MVN.com on February 26, 2008.  Since the MVN.com site is defunct and its articles are no longer available on the web, I am re-publishing the article here.
In Part 1 of this analysis, we examined the league numbers for batting average on balls in play (BABIP) and whether Bannister was able to beat the league BABIP by pitching in favorable counts. We found that he did not gain any particular advantage by inducing more balls in play on two-strike counts, so we turn elsewhere to seek an explanation for his 2007 performance.
Part 1
Part 2
Part 3

What pitches does Brian Bannister throw? The scouting reports tell an interesting tale, especially if you follow them back a couple years. In the minor leagues, the cut fastball was reputed to be his best pitch. His four-seam fastball was thrown in the high 80’s, touching 90, although he was able to locate it well, his curveball was a big breaker that was considered a plus pitch, his changeup was a work in progress, and his slider was regarded as a pitch likely to be scrapped. But in the fall of 2006 in the Mexican League, Bannister worked on a two-seam fastball, and after joining the Royals in trade for Ambiorix Burgos, he scrapped his cutter, experimented with different speeds on his curveball, and started throwing a slider again.
What can we see in the PITCHf/x data regarding his pitch repertoire in 2007?

(more…)

Note: This article was originally published at the Statistically Speaking blog at MVN.com on February 24, 2008.  Since the MVN.com site is defunct and its articles are no longer available on the web, I am re-publishing the article here.

I’ll warn you from the start that the title is a tad ambitious. I don’t know exactly how Brian Bannister wins in the major leagues with a below-average fastball speed, but I hope to share some of what I have learned on the topic. This article will take the form of a three-part series.

Part 1
Part 2
Part 3

In case you’ve been hiding under the proverbial sabermetric rock the last few weeks–maybe you’re one of those weirdos who believe players are human or you’ve been out of your garage recently to look at the sky–Brian Bannister gave a fascinating three-part interview to Tim Dierkes at MLB Trade Rumors last month.

In Part 3 of the interview, Bannister talked about his opponents’ batting average on balls in play (BABIP).

I think a lot of fans underestimate how much time I spend working with statistics to improve my performance on the field. For those that don’t know, the typical BABIP for starting pitchers in Major League Baseball is around .300 give or take a few points. The common (and valid) argument is that over the course of a pitcher’s career, he can not control his BABIP from year-to-year (because it is random), but over a period of time it will settle into the median range of roughly .300 (the peak of the bell curve). Therefore, pitchers that have a BABIP of under .300 are due to regress in subsequent years and pitchers with a BABIP above .300 should see some improvement (assuming they are a Major League Average pitcher).

Because I don’t have enough of a sample size yet (service time), I don’t claim to be able to beat the .300 average year in and year out at the Major League level. However, I also don’t feel that every pitcher is hopelessly bound to that .300 number for his career if he takes some steps to improve his odds – which is what pitching is all about.

In the interview, Bannister postulated a reason for his success on BABIP.

So, to finally answer the question about BABIP, if we look at the numbers above, how can a Major League pitcher try and beat the .300 BABIP average? By pitching in 0-2, 1-2, & 2-2 counts more often than the historical averages of pitchers in the Major Leagues. Until a pitcher reaches two strikes, he has no historical statistical advantage over the hitter. In fact, my batting averages against in 0-1, 1-0, & 1-1 counts are .297/.295/.311 respectively, very close to the roughly .300 average.

My explanation for why I have beat the average so far is that in my career I have been able to get a Major League hitter to put the ball in play in a 1-2 or 0-2 count 155 times, and in a 2-0 or 2-1 count 78 times. That’s twice as often in my favor, & I’ll take those odds.

This interview has gotten a lot of buzz in sabermetric cyberspace. Several people have taken a look at BABIP at different ball-strike counts, including my colleague at StatSpeak, Pizza Cutter. There seems to be some ability for the pitcher to control the count on which hitters put balls into play, but it looks like a fairly small effect on average. (Pizza, correct me if I’m summarizing your conclusions incorrectly.)

Bannister also mentioned to Dierkes that getting two strikes on the hitter gives him the strategic advantage in terms of pitch selection.

It is obvious that hitters, even at the Major League level, do not perform as well when the count is in the pitcher’s favor, and vice-versa. This is because with two strikes, a hitter HAS to swing at a pitch in the strike zone or he is out, and he must also make a split-second decision on whether a borderline pitch is a strike or not, reducing his ability to put a good swing on the ball. What this does is take away a hitter’s choice. If I throw a curveball with two strikes, the hitter has to swing if the pitch is in the strike zone, whether he is good at hitting a curveball or not. He also does not have a choice on location. We are all familiar with Ted Williams‘ famous strike zone averages at the Baseball Hall of Fame. It is well-known that a pitch knee-high on the outside corner will not have the same batting average or OBP/SLG/OPS as one waist-high right down the middle. Here is a comparison of the batting averages and slugging percentage on my fastball vs. my curveball:

Fastball: .246/.404
Curveball: .184/.265

We do know from John Walsh’s work something about batting average and slugging percentage against the typical major-league fastball (.330/.521) and curveball (.310/.471). If Bannister is correct in his numbers, he’s doing quite a bit better than the league with both the fastball and curveball. But is Bannister correct in the numbers he quotes and assertions he makes?

So far, most people are accepting what Bannister said at face value. Let’s take a closer look and see if we should believe his numbers and conclusions. We’ll draw on two data sets from the 2007 season. One is the standard pitch-by-pitch result data for all of Bannister’s 2603 pitches in 2007. With this data set we can examine results on balls in play and how Bannister performed in various ball-strike counts. The second data set is the detailed PITCHf/x trajectory data recorded for 1304 of Bannister’s pitches, or about half of his starts. With this data set we can identify pitch types and reliable strike zone location information in order to gain a greater understanding of Bannister’s pitching strategies.

(more…)

Note: This article was originally published at the Statistically Speaking blog at MVN.com on December 22, 2007.  Since the MVN.com site is defunct and its articles are no longer available on the web, I am re-publishing the article here.

What if we knew what type of pitches every major league pitcher threw? What if we had detailed pitch-by-pitch data about how he used those pitches in every game situation? What if this information was accurate and freely accessible to baseball researchers?

Let’s begin with some history. Since Sportvision’s PITCHf/x system was unveiled during the 2006 playoffs, people have been thinking about using the detailed pitch data to classify pitches by type. Reference this comment by MLBAM’s Director of Stats, Cory Schwartz:

“When the system is installed in all 30 ballparks, it will provide unprecedented accuracy, consistency and depth of data to the measurement of speed and trajectory of each pitch,” Schwartz said. “Ultimately we’ll be able to use this data to determine the pitch type in real time and with greater accuracy than ever before. By recording all of this data in real time, we can provide it to broadcasters such as FOX, in-stadium scoreboards, fans via Enhanced Gameday, clubs and other business partners.

It wasn’t long before Baseball Analysts’ Joe Sheehan was leading the public research down that path, too, publishing articles in the spring of 2007 about pitch classification for pitchers like Jeff Weaver, Mike Mussina, and Kenny Rogers, using the data from the 2006 playoffs.

In April 2007, the PITCHf/x system was installed in nine ballparks, and this produced a wealth of data that encouraged more people to join the analysis fun. Dan Fox, Bill Ferris, and Steve West were among the leading PITCHf/x researchers in the first half of 2007, and although the work in the field covered a number of topics, pitch classification was often at the forefront.

Soon the quest turned toward developing a set of rules to classify pitches for many pitchers, perhaps for every major league pitcher. John Walsh published the early definitive article on this topic. In August, the analysis really began to heat up; for example, see these articles from John Beamer and Joe Sheehan. The quest for a pitch classification algorithm was on.

(more…)

Note: This article was originally published at the Statistically Speaking blog at MVN.com on February 18, 2008.  Since the MVN.com site is defunct and its articles are no longer available on the web, I am re-publishing the article here.

Recent evidence may suggest otherwise, but I am still a contributor to Statistically Speaking. I’ve been working on an analysis that has been more difficult to bring to fruition than I expected; that, along with “real life” getting in the way more of late, is what has severely cut into my posting frequency.

However, in the process of number crunching for the analysis I’m doing, I came across some statistics that I haven’t seen posted publicly anywhere, not even in the Baseball-Reference splits. (Some of it is in the B-R splits, but not most of it.) Maybe I’ve just missed them, in which case drop me a line and let me know where else you found them. I thought these might be interesting to a few other people, so I’ll share them. Mostly, I’m just putting the numbers up here for the rest of you to enjoy, but I’ll also make a few comments on some trends that stuck out to me.

I’m looking at pitch data broken down by ball-strike count. I’m using the MLB Gameday 2007 data as my source. Today I present the breakdown of types of balls put into play by the hitter.

Ball Strike Total Pitches Total Safe Total Out Single Double Triple Home Run Field Error Other Safe
0 0 22029 0.341 0.659 0.214 0.069 0.007 0.039 0.012 0.001
0 1 17222 0.329 0.671 0.222 0.062 0.005 0.027 0.012 0.001
0 2 7878 0.319 0.681 0.228 0.049 0.005 0.022 0.013 0.001
1 0 14030 0.344 0.656 0.212 0.070 0.007 0.044 0.010 0.001
1 1 16576 0.334 0.666 0.214 0.066 0.006 0.034 0.012 0.001
1 2 14626 0.326 0.674 0.220 0.059 0.006 0.025 0.014 0.001
2 0 5015 0.355 0.645 0.202 0.077 0.007 0.056 0.012 0.000
2 1 10308 0.349 0.651 0.212 0.074 0.007 0.041 0.014 0.001
2 2 14861 0.330 0.670 0.215 0.062 0.009 0.030 0.012 0.001
3 0 251 0.402 0.598 0.167 0.120 0.008 0.092 0.012 0.004
3 1 4393 0.376 0.624 0.214 0.083 0.009 0.056 0.013 0.001
3 2 11019 0.351 0.649 0.216 0.070 0.007 0.045 0.012 0.001
total 138208 0.338 0.662 0.216 0.066 0.007 0.036 0.012 0.001
Ball Strike Ground Out Fly Out Pop Out Line Out Force Out Ground into DP
0 0 0.208 0.195 0.073 0.043 0.036 0.034
0 1 0.270 0.183 0.067 0.047 0.034 0.034
0 2 0.291 0.181 0.070 0.047 0.039 0.033
1 0 0.225 0.206 0.078 0.048 0.031 0.032
1 1 0.267 0.194 0.070 0.046 0.031 0.030
1 2 0.293 0.181 0.076 0.047 0.033 0.028
2 0 0.218 0.217 0.077 0.051 0.028 0.027
2 1 0.254 0.198 0.075 0.049 0.026 0.025
2 2 0.278 0.194 0.076 0.051 0.031 0.025
3 0 0.171 0.219 0.096 0.040 0.024 0.020
3 1 0.213 0.213 0.081 0.049 0.023 0.021
3 2 0.264 0.212 0.080 0.055 0.009 0.012
total 0.254 0.195 0.074 0.048 0.030 0.029
Ball Strike Sac Bunt Sac Fly Double Play Bunt Ground Out Field. Ch. Out Bunt Pop Out Other Out
0 0 0.033 0.014 0.004 0.010 0.002 0.005 0.001
0 1 0.015 0.010 0.004 0.004 0.002 0.002 0.000
0 2 0.004 0.010 0.003 0.000 0.002 0.001 0.001
1 0 0.014 0.011 0.004 0.002 0.002 0.001 0.000
1 1 0.010 0.008 0.003 0.003 0.002 0.001 0.000
1 2 0.002 0.007 0.003 0.000 0.002 0.000 0.000
2 0 0.008 0.013 0.005 0.000 0.002 0.000 0.000
2 1 0.005 0.010 0.003 0.002 0.002 0.000 0.000
2 2 0.001 0.009 0.003 0.000 0.002 0.000 0.000
3 0 0.000 0.024 0.000 0.000 0.004 0.000 0.000
3 1 0.004 0.012 0.004 0.001 0.003 0.000 0.000
3 2 0.001 0.009 0.005 0.000 0.001 0.000 0.000
total 0.011 0.010 0.004 0.003 0.002 0.001 0.000

Ball in Play Safe Percentage vs Count

A hitter reaches base safely more often on balls in play when the count is in his favor. Don’t change the channel, the revelations like that just keep on coming at StatSpeak, and you don’t want to miss one!

Okay. My first slightly less than completely and utterly obvious observation is that the home run rate is strongly tied to the count.

Ball in Play Home Run Percentage vs Count

The doubles rate shows the same effect, but smaller, as does the triples rate to some extent. The singles rate stays pretty flat with respect to count, although there is a bit of an inverse effect–in better hitter’s counts, the hitter gets more extra base hits and slightly fewer singles.I haven’t looked at the type of batted ball (fly ball, line drive, ground ball, bunt, etc.) that results in hits. That’s a bit more difficult to parse out of the Gameday data. Since it doesn’t have its own field, getting that information requires some regular expression matching on the text description of the play. That’s fairly straightforward but nonetheless a nontrivial bit of coding that makes it a project for some point in the future rather than part of this data set for me.

Ball in Play Groundout-Flyout Ratio vs Count

Another thing I noticed was that there were more groundouts and less flyouts the more strikes and less balls there were in the count. As pitchers gain the upper hand, they tend to get more groundball outs. I didn’t include popups and line drives in the accompanying chart since they didn’t show a strong tendency relative to count.

I saw a couple other things that are obvious once you think about them, but it was interesting to me to see them reflected in the data. The first was that force outs, GIDPs, and fielder’s choice outs all go down dramatically with a 3-2 count, dropping from 6.4% to 2.3% of balls in play. Presumably this is because the runners are often going with the pitch on 3-2.

The second thing that interested me was the favorite counts for hitters to bunt for an out. (Bunting for a hit is not included for the reason mentioned previously.)

Count Bunt Outs
0-0 0.043
0-1 0.019
0-2 0.004
1-0 0.016
1-1 0.013
1-2 0.002
2-0 0.008
2-1 0.006
2-2 0.001
3-0 0.000
3-1 0.005
3-2 0.001

If I don’t get around to presenting my full analysis in a timely fashion, I’ll see if I can present a few more statistical tidbits like this along the way.

Note: This article was originally published at the Statistically Speaking blog at MVN.com on December 13, 2007.  Since the MVN.com site is defunct and its articles are no longer available on the web, I am re-publishing the article here.

I don’t know any other major league pitcher who relies on his cut fastball to nearly the same extent as Mariano Rivera, but there are many pitchers who use a cutter to some degree. Most of them, like Josh Beckett, merely put a little “cut” on a fastball now and then, and it’s debatable whether to classify it as a separate pitch in their repertoire. Some of them, like Greg Maddux, throw both a cut fastball and another fastball as fairly distinct pitches. A few others, like our subject today, throw a single type of fastball that moves more like a cutter than it does like a traditional four-seamer. Do we also label this kind of a pitch a cut fastball?

The cutter is second only, perhaps, to the slider in the flexibility of its definition. Almost every starting pitcher is said to throw a cutter by an obscure report somewhere. I’ve learned to discount these notional references, but I pay a lot more attention when the pitcher himself or his catcher says he threw a cutter.

Which brings us to Joakim Soria, closer for the Kansas City Royals. The Royals picked him up from the San Diego Padres in the Rule 5 draft last winter, and what a find that was! He had been pitching well in the Mexican League, and showed his stuff for the Royals last year when the closer of plan, Octavio Dotel, was first injured and later traded. Soria appeared in 62 games, pitched 69 innings, allowing 46 hits, 19 walks, and only three home runs, while racking up 75 strikeouts to go with 17 saves and 2.48 ERA.

What pitches does Joakim Soria throw? His catcher John Buck reports:

“It’s hard to pick him up. His ball has a natural cut to it. Not as much as [Rafael] Soriano but it does have a cut to it. That’s just his natural fastball,” Buck said.

“He has a great slider and curveball and can throw his change-up on any count. You have to kind of speed up your bat to get the head up to hit the cutter and, all of a sudden, he throws a changeup and it makes it difficult — sitting in-between those two is a tough place to be as a hitter.”

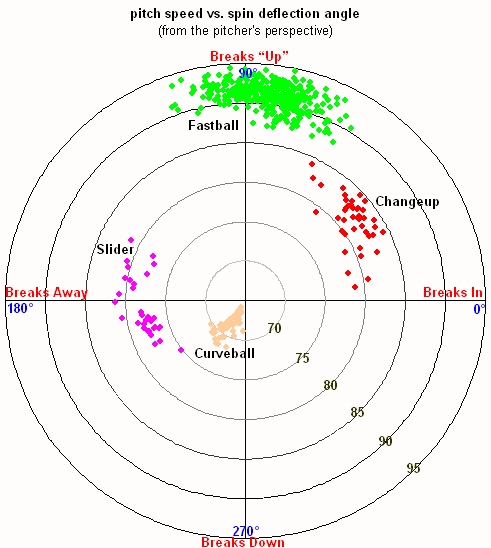
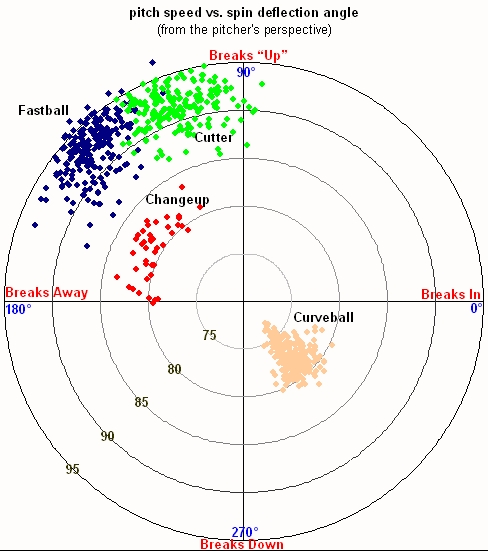
So his catcher calls his fastball a cutter. Let’s take a look at the data we have from PITCHf/x for the 2007 season, covering 477 pitches for Joakim Soria. I’ll begin with a graph of pitch speed versus the angle at which the spin on the ball is deflecting the pitch.

Soria has a fastball with a lot of cut that runs 89-94 mph. The cut fastball is his bread-and-butter pitch; he uses it for 69% of his pitches to lefties and 78% of his pitches to righties.

He has a changeup with a lot of lateral action that he throws 80-84 mph. He uses the changeup almost exclusively to lefties, making up 19% of his pitches to them.

As his off-speed pitch to righties, Soria uses a slider with a big break that runs 76-81 mph. The slider makes up 11% of his pitches to right-handed hitters.

Rounding out his repertoire is a slow curveball that Soria throws 66-71 mph. The curveball makes up 10% of his pitches, and he uses it equally to lefties and righties.

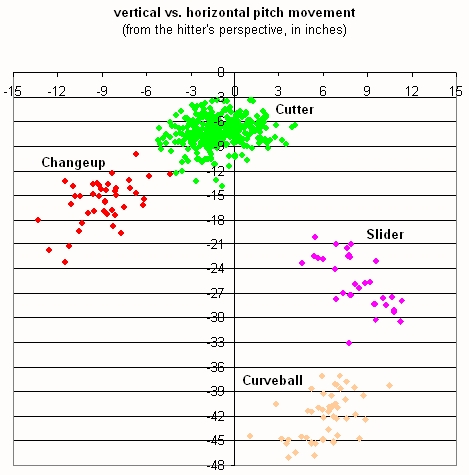
Let’s look at how these pitches move from the hitter’s perspective.

All of Soria’s pitches have good movement. His fastball has”cut” to it, and his changeup has good lateral and vertical movement when compared to his fastball. His slider looks like most pitchers’ curveballs, and his curveball is a slow ball with a lot of drop.

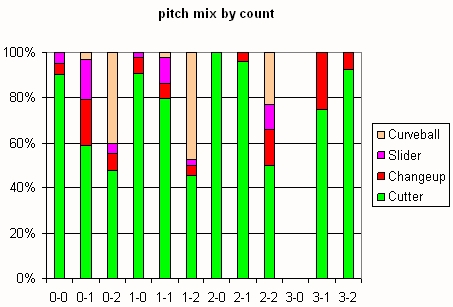
Next, let’s look at what pitches Soria throws in each ball-strike count.

Count Cutter Changeup Slider Curveball Total
0-0 114 6 6 0 126
0-1 40 14 12 2 68
0-2 19 3 2 16 40
1-0 39 3 1 0 43
1-1 35 3 5 1 44
1-2 19 2 1 20 42
2-0 14 0 0 0 14
2-1 24 1 0 0 25
2-2 22 7 5 10 44
3-0 0 0 0 0 0
3-1 3 1 0 0 4
3-2 25 2 0 0 27
Ahead 78 19 15 38 150
Even 171 16 16 11 214
Behind 105 7 1 0 113
0 strikes 167 9 7 0 183
1 strike 102 19 17 3 141
2 strikes 85 14 8 46 153
Ball 0-1 266 31 27 39 363
Ball 2-3 88 11 5 10 114
Total 354 42 32 49 477

And here’s the same information presented graphically:

We can see that until he gets a strike, Soria uses almost only the cut fastball, and when he gets two strikes, he brings out the curveball pretty often, except in a 3-2 count, where he sticks with the cutter. This would imply that the curveball is his strikeout pitch and that he has trouble getting strikes with his off-speed pitches.

As a second opinion, you can look at what Josh Kalk’s algorithm spit out for Joakim Soria. Josh also has release point data there if you are interested in that.

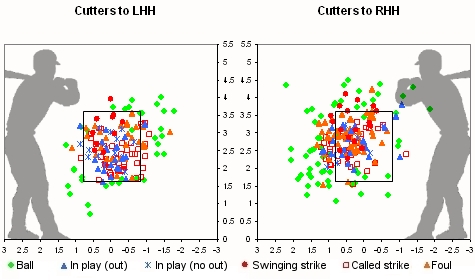
Finally, let’s examine where Soria throws his pitches and what results he gets.

LHH Ball CS Foul SS IPO IPNO TB BABIP SLGBIP Strk% Con%
Cutter 34 44 30 10 20 8 12 0.286 0.429 77% 85%
Changeup 15 3 11 5 5 2 3 0.286 0.429 63% 78%
Slider 2 0 0 0 0 0 0 0%
Curveball 10 1 1 10 1 0 0 0.000 0.000 57% 17%
RHH Ball CS Foul SS IPO IPNO TB BABIP SLGBIP Strk% Con%
Cutter 60 43 54 18 24 9 15 0.273 0.455 71% 83%
Changeup 0 1 0 0 0 0 0 100%
Slider 14 3 0 5 6 2 5 0.250 0.625 53% 62%
Curveball 10 5 2 7 2 0 0 0.000 0.000 62% 36%

–-
CS=called strike, SS=swinging strike, IPO=in play (out), IPNO=in play (no out), TB=total bases, BABIP=batting average on balls in play (including home runs), SLGBIP=slugging average on balls in play (including home runs). For Strk% all pitches other than balls are counted as strikes. Con% = (Foul+IPO+IPNO)/(Foul+IPO+IPNO+SS).

Our earlier conclusions seem to hold up.

Here are Soria’s results for the cut fastball.

To lefties, Soria seems willing to pound the zone with the cutter, and his results indicate that strategy works. Against righties, he works more up and away. He misses the zone a little more often, and he generates more foul balls, but his results are still good.

Moving on, let’s see the results for the changeup and slider:

As I mentioned earlier, Soria uses the changeup to lefties and the slider to righties. In both cases, he likes to throw down and away. It looks like he has trouble throwing the slider consistently for strikes.

Last, but not least, the curveball.

Soria gets a lot of swinging strikes in the zone to both lefties and righties. The only difference appears to be when he misses–down and away to righties, and up and away or down and in to lefties.

Since I mentioned earlier that the curveball looked like Soria’s strikeout pitch, let’s check on that. We have PITCHf/x data for 40 of his 75 strikeouts. For those 40 K’s, 23 of them were on the curveball, 9 on the cutter, 4 on the changeup, and 3 on the slider.

I hope you enjoyed the analysis of one of my favorite players from my favorite team. My work’s had a bit of an “East Coast bias” lately, which feels a bit odd to me. I don’t expect to continue solely in that vein. If nothing else, you should see a Royal popping up in this space now and then.

Note: This article was originally published at the Statistically Speaking blog at MVN.com on January 29, 2008.  Since the MVN.com site is defunct and its articles are no longer available on the web, I am re-publishing the article here.

Despite winning the American League West with a 94-68 record last year, the LA of Anaheim Angels have gotten short shrift from the PITCHf/x analysts thus far. The only writeup that the pitching staff has gotten was one by Joe Sheehan on John Lackey three weeks into the season. I’d like to remedy that a little bit today. The Angels had three outstanding starters: Lackey, Kelvim Escobar, and Jered Weaver. Let’s take a detailed look into the pitching performance of Kelvim Escobar.

Escobar is a 31-year-old right hander from LaGuaira, Venezuela. He was a former starter turned reliever (and closer) and back to starter again for the Toronto Blue Jays before joining the Anaheim Angels in 2004. He’s struggled to stay completely healthy, but overall he has turned in some fine numbers for the Angels in four years: a 43-35 record and 3.60 ERA in 109 starts, allowing 611 hits and 213 walks against 561 strikeouts in 653 innings.

Since the Big A was one of the original nine stadiums to have a camera system installed from the beginning of the 2007 season, the large majority of Escobar’s season was recorded by the PITCHf/x system, 2469 of his total 3141 pitches. This gives us a good data set to identify his pitches and examine his pitching tendencies.

Escobar throws quite an array of pitches: a four-seam and two-seam fastball, a changeup and split-finger, a slider and a curveball. According to scouting reports, he is capable with all six pitches.

Here I’ve shown two graphs that I use for pitch classification. The first graph shows the speed of his pitches versus the direction they break, in polar graph format. The second graph shows the movement due to the forces of spin deflection and gravity on his pitches in the last quarter-second before they cross the plate.

There are a couple other ways to look at the vertical vs. horizontal deflection over the whole pitch trajectory:


Escobar’s four-seam fastball runs 92-96 mph, and the average spin deflection he gets on the four-seamer is a 10-inch hop and a 4-inch tail in toward right-handers. Compared to a league-average fastball, that’s 3 mph faster but with a couple inches less lateral movement, probably due to the fact that his motion is more over-the-top than many right-handed pitchers. The four-seamer is one of Escobar’s main pitches to both lefties (26% of the time) and righties (27%).

Escobar’s two-seam fastball also runs 92-96 mph, but its average spin deflection is an 8-inch hop and a 7-inch tail in toward right-handers. The two-seamer is his primary pitch to lefties (28% of the time) and also a main pitch to right-handers (24%). I made the division between the four-seamer and the two-seamer by looking at the spin direction of each pitch on a game-by-game basis, but the dividing line between the two is still a bit fuzzy to me.

His split-finger fastball runs 85-89 mph, and its average spin deflection is a 6-inch hop and a 6-inch tail in toward right-handers. Escobar uses the splitter fairly often to left-handers (15% of the time) but only infrequently to right-handers (6%).

His changeup runs 83-87 mph, and its average spin deflection is a 10-inch hop and a 3-inch tail in toward righties. The 9-mph separation between his fastball and changeup is about average for major league pitchers. He uses the changeup more often to lefties (16% of the time) but also some against righties (11%).

Escobar’s slider runs 85-89 mph, and its average spin deflection is a 3-inch hop and a 2-inch break away from righties. That’s about 3 mph harder than the average major-league slider, with typical movement. The slider is one of his favorite pitches to right-handed hitters (25% of the time) and is rarely used against lefties (2%).

Finally, his curveball runs 79-84 mph, and its average spin deflection is a 3-inch drop and a 1-inch break away from right-handers. That’s about 4 mph harder than the average major-league curveball, with 12-to-6 movement that is somewhat rare. (The spin deflection on the average major-league curveball is a 2-inch drop and a 5-inch cut. John Walsh’s article is my source for league average numbers.)

Next, let’s look at how Escobar mixes his pitches in different ball-strike counts, which I’ve split out by batter handedness. The picture gets a bit messy when a man throws six different pitches, but let’s dive in and see what we see.


To lefties, Escobar uses the four-seamer on any count and relies on it a little more if he falls behind. He throws the curveball early in the count, 22% of the time with no balls, 9% of the time with 1 ball, and only 3% of the time with 2 or 3 balls in the count. He favors the two-seamer with 0 or 1 strike, 33% of the time, but uses it only 16% of the time with 2 strikes. Instead, with 2 strikes he relies on the splitter 32% of the time. He’ll throw the changeup at almost any count except 0-2 and 3-0, but he likes to throw it more when he’s behind in the count, in which case he throws it 25% of the time.

Early in the count with Escobar, lefties should expect to see the two-seamer, the four-seamer, the curveball, and the changeup, in that order. If Escobar gets the hitter down 0-2 or 1-2, he should expect the splitter (41% of the time) or perhaps a fastball (41%), but if the count goes 2-2 or 3-2, he should start to watch for the changeup, too (33%).

To righties, early in the count, Escobar throws hard stuff, 31% two-seamers, 28% sliders, 23% four-seamers, and only 18% of his other three pitches combined. When he gets 2 strikes, the two-seamer disappears (only 3%), but he’s willing to show the splitter (14%). The changeup gets used a little with 1 strike (11%), but at 2-1 or 2-2 it’s a favored pitch (26%), and at 3-2, it’s his favorite pitch (34%), like it was to lefties. Righties can expect the curveball mainly at a single count: 0-2, where Escobar uses it 28% of the time; it’s little used (6%) in other counts.

What kind of results does Escobar get with each of his pitches? His four-seam fastball is a pretty good pitch, but his two-seamer grades out poorer. All four of his off-speed pitches are above average. I should mention that the PITCHf/x games for Escobar are missing his two worst starts of the year, which skews all the following numbers a little bit in his favor.

LHH _Ball_ _CS_ _Foul_ _SS_ InPlay _Avg_ _BABIP_ _SLG_ __HR__
4-seamer 0.33 0.26 0.17 0.06 0.18 0.315 0.315 0.444 0.000
2-seamer 0.40 0.17 0.18 0.05 0.20 0.338 0.317 0.523 0.031
Splitter 0.35 0.09 0.19 0.17 0.19 0.294 0.273 0.441 0.029
Changeup 0.39 0.14 0.15 0.12 0.20 0.216 0.216 0.297 0.000
Slider 0.22 0.11 0.39 0.06 0.22 0.500 0.500 0.750 0.000
Curveball 0.35 0.32 0.09 0.13 0.11 0.353 0.353 0.412 0.000
RHH _Ball_ _CS_ _Foul_ _SS_ InPlay _Avg_ _BABIP_ _SLG_ __HR__
4-seamer 0.41 0.17 0.20 0.08 0.14 0.176 0.176 0.216 0.000
2-seamer 0.39 0.26 0.14 0.04 0.17 0.415 0.392 0.585 0.038
Splitter 0.36 0.04 0.15 0.19 0.26 0.158 0.158 0.211 0.000
Changeup 0.27 0.06 0.12 0.28 0.26 0.237 0.216 0.316 0.026
Slider 0.35 0.17 0.11 0.16 0.22 0.254 0.243 0.352 0.014
Curveball 0.39 0.23 0.11 0.14 0.14 0.154 0.154 0.154 0.000
Lg. Avg. _Ball_ _CS_ _Foul_ _SS_ InPlay _Avg_ _BABIP_ _SLG_ __HR__
Fastball 0.36 0.19 0.19 0.06 0.19 0.330 0.304 0.521 0.037
Changeup 0.40 0.11 0.14 0.13 0.21 0.319 0.295 0.502 0.035
Slider 0.36 0.14 0.17 0.13 0.20 0.310 0.286 0.481 0.033
Curveball 0.40 0.19 0.13 0.11 0.21 0.310 0.290 0.471 0.029

The league average information comes from John Walsh’s article. In the following pitch location charts, I’ve changed my color-coding a bit to try to improve readability for those with color blindness. Hopefully the new system is an improvement.

Escobar works with the four-seamer on the outer half of the plate to both lefties and righties, although with lefties he works down more and avoids coming inside, and with righties he works up more and works inside just off the plate. He has some trouble throwing the four-seamer for strikes to righties (only 59%, compared to 64% league average), but when he does, and they put in play, he gets very good results: .176/.216 (avg/slg), compared to .330/.521 major-league average off the fastball.

To lefties, he’s much better at throwing the four-seamer for strikes (67%), and he gets a lot of called strikes (26% compared to 19% league average), but his results on balls in play are only fair: .315/.444 avg/slg. He didn’t allow a single home run in 31 fly balls hit off the four-seamer in PITCHf/x games. That is unusual–fastballs are the most homered-upon pitch for most pitchers.

Escobar has trouble throwing the two-seamer for strikes, getting it over only 60% of the time. As with the four-seamer, he works mainly on the outer part of the plate to both lefties and righties. However, both lefties and righties have good success when they put the two-seamer into play. Lefties hit .338/.523, and righties hit .415/.585.

The splitter is Escobar’s strikeout pitch to lefties, and you can see why. They swing and miss at it down and away more often than not. He doesn’t necessarily throw it in the strike zone that much, but he gets strikes because the hitters chase it. When he does get it in the zone, hitters do much better with it, making at least decent contact and racking up a .294/.441 line, including a home run.

He doesn’t throw the splitter nearly as much to righties, although I wonder if maybe he should. He still gets a lot of swings and misses (19%, compared to 13% league average), but righties are able to put the ball in play almost every time he gets the splitter in the zone. However, the right-handed hitters don’t fare nearly as well as lefties on balls in play, hitting only a meager .158/.211. Perhaps it’s the small sample size (19 balls in play), or maybe righties really do have trouble getting good wood on the splitter.

The changeup is the first pitch where we see a marked contrast in Escobar’s location to lefties and righties. To lefties, he pitches away, away, away. He gets some swings and misses in the zone, but lefties don’t chase the changeup out of the strike zone much. On balls hit into play by lefties, Escobar does well, a .216/.297 line, compared to .319/.502 against an average major-league changeup.

To righties, he throws the changeup mostly in the zone or on the corner low and away. He gets a lot of swings and misses, especially on the outside corner. The changeup is a very effective pitch against righties. No wonder he likes to throw it as a strikeout pitch to righties. Moreover, even though he pounds the heart of the zone, righties have little luck on balls in play, hitting only .237/.316. Most right-handed pitchers avoid throwing the changeup to right-handed hitters, but for Escobar in that situation, it’s a great pitch and one he could perhaps use even more often.

As you can see, his slider is rarely used to lefties, mostly thrown up and in and fouled off. To righties, he uses the slider a lot, and to good effect. He gets a good number of called strikes (17%, versus 14% league average) and swinging strikes (16%, versus 13% average), and when the ball is put in play, Escobar also fares well, allowing a .254/.352 avg/slg, compared to .310/.481 against an average major-league slider. Those numbers include allowing only 1 home run on 27 fly balls hit by righties off the slider–luck or skill?

Finally, we come to the curveball, Escobar’s least-used pitch. He throws it mostly down and away to both righties and lefties, although he also throws it in the zone quite a bit. He gets a lot of called strikes, especially to lefties (32%), but also to righties (23%), compared to league average of 19% with the curve. Most pitchers rarely throw the curveball as the first pitch to a batter. Escobar, on the other hand, often throws a lefty a curveball right across the plate for strike one looking. Lefties don’t often make contact with the curveball, but when they do, the results are decent: .353/.412, compared to league average against the curve of .310/.471.

Right-handers see the curveball more often with two strikes, and it’s a good strikeout pitch for Escobar, both swinging (at balls in the dirt) and looking. Righties don’t make contact with the curve very often, either, and when they do, their results are particularly poor: in 13 curveballs in play, righties hit 10 groundballs (including two double plays), 2 fly balls, and one line drive. The line drive and one groundball landed as singles, for a .154 average.

In summary, Escobar has a solid four-seam fastball which he complements with a weaker two-seamer, and his array of off-speed pitches is impressive. His changeup, splitter, curveball, and slider are all well above average pitches, and some of them, particularly his changeup, are among the best in baseball. He struggles with control on his fastball, and this, along with the recurrent health problems, is probably all that keeps him from being one of the very best pitchers in baseball.

As a final note, I thought this was a great photo from MLB.com of Kelvim Escobar in full stride.

If you enjoyed this article, you might be interested in my similar previous analysis of Erik Bedard, Johan Santana, James Shields, Mariano Rivera, Joakim Soria, Josh Beckett, Joba Chamberlain, or Eric Gagne.

Note: This article was originally published at the Statistically Speaking blog at MVN.com on January 9, 2008.  Since the MVN.com site is defunct and its articles are no longer available on the web, I am re-publishing the article here.

Who is the best pitcher in baseball right now? Some might answer that question with Jake Peavy or Josh Beckett, but I’d guess that at least 7 out of 10 times, the answer you would get is Minnesota Twins left-hander Johan Santana. Santana is a 28-year-old from Tovar, Venezuela, and after his fourth full year in the starting rotation, he already owns two Cy Young Award trophies.

Now, as Santana approaches the final season of the 4-year, $39.75 million contract he signed three years ago, the Twins appear eager to trade him, and the reported suitors include such teams as the New York Yankees, Boston Red Sox, and New York Mets, subject to Santana’s approval. I’ll leave the predictions of where he’ll land to those who are better qualified or more eager to comment than I am. However, I’d like to take a look at the pitching repertoire and strategy of possibly the best pitcher in baseball.

If you look at the scouting reports, they all talk about Johan Santana’s devastating changeup and how he works to make his throwing motion identical for all pitches. Most scouting reports list three pitches for Santana–fastball, changeup, and slider–and mention that his changeup comes in 15-20 mph slower than his fastball. Were this true, it would be highly unusual. Most major league changeups are 7-10 mph slower than the pitcher’s fastball. A few scouting reports speak of five pitches–two fastballs, a slider, a circle change, and a straight change. The most useful and interesting scouting information I found was an interview from 2006 that Pat Borzi conducted for the Sporting News with Johan Santana and his catcher Joe Mauer.

Santana throws four pitches for strikes-four- and two-seam fastballs between 92 and 95 mph, a slider/curve in the 84- to 87-mph range and a changeup that’s about 15 to 20 mph slower than the fastball. The changeup is his strikeout pitch; when Santana is on, he throws it from the same arm angle and release point as his fastball, and hitters can’t tell the difference until it’s too late.

I also found this quote from Santana interesting given that most people acknowledge his changeup as his best pitch:

“I want to make sure my two-seam fastball is working,” Santana says. “That’s my best pitch, and it’s going to make my other pitches look even better. That’s what I try to do all the time.”

We have detailed data from the PITCHf/x system for 1032 of Santana’s 3345 pitches during the 2007 season. Let’s dive in and see what we can learn about Santana’s repertoire and effectiveness with his various pitches.

Santana has at least three obvious pitch groupings: fastball, changeup, and breaking ball. Here I’ve shown two graphs that I use for pitch classification. The first graph shows the speed of his pitches versus the direction they break, in polar graph format. The second graph shows the movement on his pitches in the last quarter-second before they cross the plate, due to the forces of spin deflection and gravity.

The fastballs run 89-95 mph, and it’s hard to tell from these graphs alone whether Santana really does throw two different fastballs or just one. Through additional analysis, which I will explain shortly, as well as Santana’s own comments, I concluded that he did in fact throw a four-seam and a two-seam fastball and have coded them separately in these graphs.

We can also see that Santana throws two different offspeed pitches. One has a movement very similar to the fastball but is thrown slower at 80-84 mph. This is his changeup. It’s interesting to note that we see a 10 mph difference in speeds between his fastball and his changeup, typical of other major league changeups and nothing like the 15-20 mph difference that was reported by other sources. I don’t know if that was just the stuff of legend or whether Santana has changed his approach in recent years. More likely, people were comparing Santana’s very slowest changeup with his very fastest fastball and writing as if that represented a typical pitching pattern.

I could not find any sign of two different changeups in Santana’s repertoire, at least not two changeups that consistently have different movement or speed.

Santana’s other offspeed pitch is an 83-88 mph breaking ball, described in various scouting reports as either a slider or a curveball. Based on the spin direction, the speed, and the direction of break, it’s very clearly a slider. In the first graph of pitch speed vs. spin deflection angle, the calculation of the spin deflection angle for some of the sliders contains a good deal of error since the spin of those sliders is nearly aligned around the direction of travel of the pitch, resulting in spin deflection of only a couple inches or less. This is one of the classic indicators of a slider.

The sliders and changeups look difficult to separate at the margins in the two graphs I presented above, but including the (x-z component of the) spin rate in the discussion makes that task much easier.

Returning to the topic I mentioned earlier, how did I determine whether Santana threw both a four-seam and a two-seam fastball? Looking at the data in aggregate, it was impossible to see a dividing line, but when I examined the spin and break on a start-by-start basis, a little bit of order appeared out of the murkiness. In some starts, two separate groupings were obvious. In most starts, the dividing line was subtle. In a few cases, it was hard to find a dividing line at all. I did notice that the fastballs with the most sink and the slowest speed were thrown almost exclusively to right-handed hitters, and this, in addition to Santana’s own comments about throwing a two-seamer, gave me confidence in making a distinction between the two fastballs.

If you look at the comments from John Walsh and John Beamer on my Erik Bedard analysis, you’ll see that having to examine the data on a start-by-start basis in order to make an accurate pitch classification diagnosis is a recurring problem. We’d like to be able to look at a pitcher’s season data as a whole. This is an important area for further investigation.

Here are a couple more traditionally-used PITCHf/x graphs of pitch movement for those who are interested:


How does Santana use his pitches to left-handed and right-handed hitters? As a left-handed pitcher, he naturally sees predominantly right-handed hitters, making up 75% of his opponents. To righties, he throws about 41% four-seam fastballs, 35% changeups, 18% two-seam fastballs, and 6% sliders. To lefties, he throws 60% fastballs, 29% sliders, 7% changeups, and 4% two-seam fastballs. Against righties he’s the stereotypical fastball-changeup Santana that I’ve heard about. Against lefties, he’s a totally different pitcher, eschewing the changeup and the two-seam fastball and relying on a fastball-slider combination.

Next, let’s look at how Santana mixes his pitches in different ball-strike counts. I’ve split this out by batter handedness as well.

Against righties, you can see that the changeup is his favorite pitch with two strikes (57% of the time), and he mixes in his two-seam fastball more if he falls behind in the count (28% when behind vs. 15% when ahead or even).

Against lefties, he’s relies on the four-seamer about 70% of the time in most situations. With two strikes he feels confident enough to occasionally (14%) introduce the changeup to lefties, and on an 0-2 count, you can count on getting a slider two thirds of the time.

What’s the bottom line–what results does Santana get with his pitches? I attempted for a while to cast the answer to that question in terms of run values for each pitch determined by linear weights, but I’ve postponed that endeavor for the moment. There are too many pieces that I haven’t figured out how to put together yet. So here are the results in the same format I used in the Bedard article.

LHH Ball CS Foul SS InPlay Avg BABIP SLG HR
Fastball 0.32 0.20 0.25 0.10 0.13 0.316 0.188 0.842 0.158
Sinker 0.70 0.10 0.00 0.10 0.10 0.000 0.000 0.000 0.000
Slider 0.34 0.13 0.17 0.17 0.19 0.308 0.308 0.462 0.000
Changeup 0.24 0.06 0.18 0.24 0.29 0.400 0.400 0.400 0.000
RHH Ball CS Foul SS InPlay Avg BABIP SLG HR
Fastball 0.32 0.20 0.26 0.12 0.11 0.235 0.188 0.500 0.059
Sinker 0.35 0.17 0.24 0.06 0.19 0.333 0.250 0.741 0.111
Slider 0.38 0.12 0.24 0.08 0.18 0.111 0.000 0.444 0.111
Changeup 0.32 0.08 0.15 0.31 0.15 0.357 0.325 0.667 0.048
Lg. Avg. Ball CStrk Foul SStrk InPlay Avg BABIP SLG HR
Fastball 0.36 0.19 0.19 0.06 0.19 0.330 0.304 0.521 0.037
Sinker
Slider 0.36 0.14 0.17 0.13 0.20 0.310 0.286 0.481 0.033
Changeup 0.40 0.11 0.14 0.13 0.21 0.319 0.295 0.502 0.035

The league average information comes from John Walsh’s article, and once again I’m using an adaptation of his format to present this information.

The four-seamer is Santana’s bread and butter, especially to lefties, and a good bit of creamy butter it has. He throws it for strikes and gets more swings and misses with it than most pitchers do. Hitters have a hard time putting the four-seamer into play, and when they do, Santana also gets really good results (a .188 BABIP compared to .304 league average BABIP on the fastball), although lefty batters–Hafner, Sizemore, and Thome–did hit three home runs off the four-seamer in our data set. He mostly pounds the zone with the pitch to both lefties and righties, although there appears to be some tendency toward pitching up and away from lefties and up and in to righties.

Santana doesn’t use the two-seamer much against lefties, and when he did, it was mostly for a ball. He works in the zone against righties and gets fairly average results with the two-seam fastball. One surprising thing to note is that he still gives up a lot of fly balls off the two-seamer; almost 70% of balls in play off the two-seamer were fly balls. The two-seamer seems like his weakest pitch based on the results we have from 2007, so I’m not sure I understand his statement from the Sporting News interview that it’s his best pitch.

Just look at all the red bleeding over the graph from the swinging strikes, and you know all you need to know about Santana’s changeup. The hitters can’t hit it. Santana can throw it for strikes just as well as his fastball. He throws it down and away from righties, and he gets a lot of swings and misses when they chase the changeup down out of the strike zone. When he gets it too close to the heart of the zone, they do make decent contact. It would go without saying, but this is an outstanding pitch.

Against lefties, Santana uses the slider mostly down and away, and he gets pretty average results with it. Against righties, he features the slider less often. When he does throw it, he keeps it inside. When he gets it up, it gets put in play, but he had fairly good results on a limited sample of balls in play except for one slider that Alex Rios launched 414 feet into the left field seats at the stadium formerly known as SkyDome.

I also looked a bit at pitch sequencing. Here’s a table showing what pitch a hitter is most likely to see from Santana based on what the previous pitch was.

LHH
Previous Pitch Fastball Sinker Slider Changeup
Fastball 66% 4% 26% 4%
Sinker 67% 0% 33% 0%
Slider 60% 9% 27% 4%
Changeup 76% 0% 24% 0%
RHH
Previous Pitch Fastball Sinker Slider Changeup
Fastball 52% 16% 5% 27%
Sinker 46% 21% 3% 31%
Slider 42% 30% 9% 18%
Changeup 43% 15% 8% 34%

I don’t notice any particular patterns to lefties, but to righties he’s more likely to throw the two-seamer after a previous two-seamer, and he’s more likely to throw a changeup after another changeup.

Johan Santana had yet another great season in 2007. He allowed a few more walks and home runs than in previous years, but without PITCHf/x data from previous seasons, I don’t have any way to know whether that was simply luck or a change in his pitching abilities and strategies.

I looked at the 11 home-run balls off Santana for which we have PITCHf/x data, and I couldn’t detect any useful patterns. They were mostly hit off pitches up and over the plate, but that doesn’t come as much of a surprise. Looking at the HitTracker data, he wasn’t burned by many short home runs barely sneaking over the fence, so he wasn’t unlucky in that regard, at least. This may be a topic for further investigation or possibly just the result of Santana being a fly ball pitcher and getting a little unlucky with how hard the hitters hit 33 of those fly balls in 2007.

Santana obviously has an outstanding changeup and a strong fastball, but you probably knew that already. What I didn’t know was how infrequently he uses the changeup against lefties or most of the other nuances of his pitching strategy. Unless you’re Joe Mauer or Mike Redmond (in which case, Hi!), hopefully you feel like you know the best pitcher in baseball a little better than you did before.

If you’re an employee of a Mr. Steinbrenner or a Mr. Henry gathering information for a future trade, by all means feel free to contact to me regarding where to send that check for my services. 🙂

Note: This article was originally published at the Statistically Speaking blog at MVN.com on January 3, 2008.  Since the MVN.com site is defunct and its articles are no longer available on the web, I am re-publishing the article here.

Baltimore Orioles ace Erik Bedard had a breakout season in 2007 before being sidelined at the end of August with an injury to his oblique muscle. Prior to his final start, he was receiving strong Cy Young Award consideration with a 13-4 record, a 2.97 ERA, and a league-leading 218 strikeouts and only 135 hits and 52 walks allowed in 176 innings. (His last start, pitching injured, resulted in final season numbers a little worse than these I’ve listed.) Compare his 2007 numbers to his previous career-best season in 2006, when he finished 15-11, with a 3.76 ERA and 171 strikeouts against 196 hits and 69 walks in 194 1/3 innings, and it’s clear he stepped up his game in 2007. How did he do it?

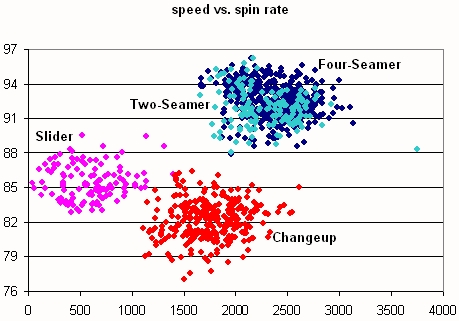
Unfortunately we don’t have any PITCHf/x data from the 2006 regular season, but we can use the PITCHf/x microscope to take a look at what Bedard did in 2007 (in the 701 pitches for which we have detailed data). What does Erik Bedard throw? Let’s take a look at his repertoire by graphing the speed of his pitches versus the direction they break.

Bedard has four pitches, as best I can tell. His famous erstwhile pitching coach will tell you he throws four different types of fastballs, but I can only see a four-seamer and a cutter. Either he throws the sinker and the “comebacker” infrequently, if at all, in game action, or they move too similarly to the four-seamer for me to differentiate them using this data.

I mentioned already that Bedard pitched with an injured oblique muscle in his final start of the year on August 26. Most of the fastballs and cutters with a speed below 90 mph were recorded in that start. He averages just over 93 mph on his four-seam fastball and 92 mph on his cut fastball. In his August 26 start, those clocked at 89 and 88 mph, respectively.

When healthy, his four-seam fastball runs 92-95 mph and breaks away from a right-hander by about 7-11 inches. The four-seamer is one his two primary pitches to right-handed hitters; he throws it 34% of the time. Against lefties, it’s his third pitch, used only 23% of the time.

His cut fastball runs 90-94 mph and breaks away from a right-hander by about 2-6 inches. The cutter is his primary pitch to lefties, used almost half the time (45%); against righties, it’s his third pitch, used 24% of the time.

Bedard also throws an occasional 80-83 mph changeup, almost exclusively to lefties (7%). Probably his best pitch is a 76-80 mph curveball, which he uses equally to righties (35%) and to lefties (32%).

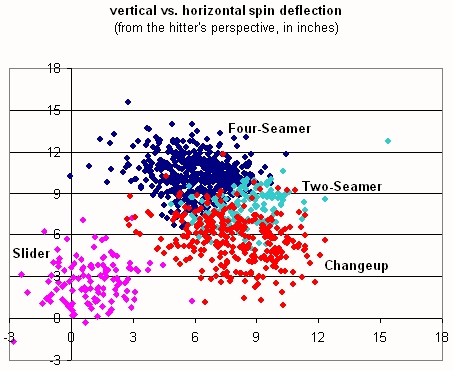
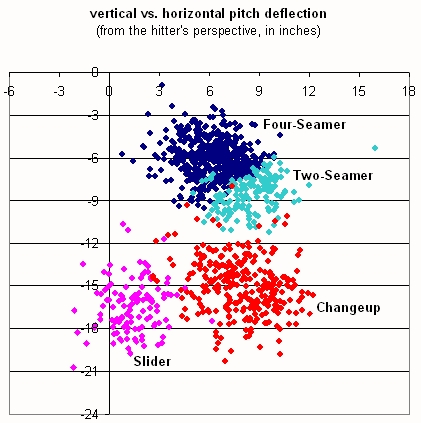
Let’s take a look at how all his pitches move, including the effect of gravity in addition to spin-induced deflection.

The slower pitches like the curveball and changeup drop more because gravity has longer to act on them.

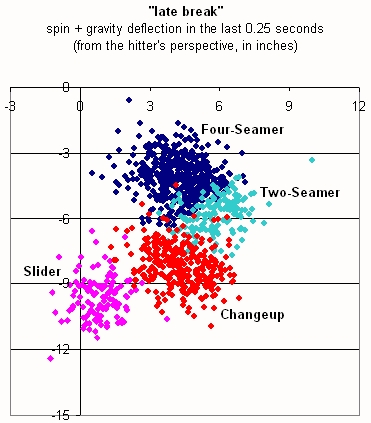
I thought it might also be interesting to show something more in line with what I believe the hitter perceives as the “late break” on a pitch, the deflection of the pitch due to both spin and gravity in the last quarter-second before it crosses the plate. Thanks go to Tom Tango for this idea.

This seems to give a more realistic guess at how a hitter might perceive the drop on a curveball compared to a fastball.

Let’s take a look at how Erik Bedard mixes his pitches in different ball-strike counts.

We can see that he uses his cutter more often early in the count or when he falls behind and his four-seam fastball more often with two strikes. He uses his curveball equally across almost all counts, except for avoiding it on 3-0 and 3-1 and showing some preference for it on 2-1 and 3-2 counts. His changeup shows up mostly on 0-1 and 1-1 counts; he throws it to righthanders 20% of the time on those two counts and only 3% of the time on other counts.

Here’s a table showing the details by count.

Count Fastball Cutter Changeup Curveball Total
0-0 54 62 4 62 182
0-1 20 26 21 33 100
0-2 27 10 0 15 52
1-0 16 22 4 22 64
1-1 18 20 9 23 70
1-2 35 8 1 24 68
2-0 5 10 0 4 19
2-1 11 5 3 20 39
2-2 24 11 0 25 60
3-0 0 4 0 0 4
3-1 8 8 0 1 17
3-2 4 8 0 14 26
Ahead 82 44 22 72 220
Even 96 93 13 110 312
Behind 44 57 7 61 169
0 strikes 75 98 8 88 269
1 strike 57 59 33 77 226
2 strikes 90 37 1 78 206
Ball 0-1 170 148 39 179 536
Ball 2-3 52 46 3 64 165
Total 222 194 42 243 701

Now, let’s examine where in the zone Bedard throws his pitches and what results he gets with them.

LHH Ball CStrk Foul SStrk InPlay Avg BABIP SLG HR
Fastball 0.48 0.16 0.16 0.03 0.16 0.600 0.600 0.600 0.000
Cutter 0.26 0.30 0.20 0.11 0.13 0.250 0.000 1.000 0.250
Changeup 1.00
Curveball 0.36 0.09 0.20 0.16 0.18 0.250 0.250 0.625 0.000
RHH Ball CStrk Foul SStrk InPlay Avg BABIP SLG HR
Fastball 0.35 0.20 0.21 0.08 0.16 0.258 0.233 0.419 0.032
Cutter 0.34 0.26 0.24 0.02 0.15 0.300 0.263 0.500 0.050
Changeup 0.54 0.05 0.12 0.02 0.27 0.273 0.200 0.636 0.091
Curveball 0.34 0.18 0.16 0.21 0.11 0.227 0.227 0.318 0.000
Lg. Avg. Ball CStrk Foul SStrk InPlay Avg BABIP SLG HR
Fastball 0.36 0.19 0.19 0.06 0.19 0.330 0.304 0.521 0.037
Cutter
Changeup 0.40 0.11 0.14 0.13 0.21 0.319 0.295 0.502 0.035
Curveball 0.40 0.19 0.13 0.11 0.16 0.310 0.290 0.471 0.029

The league average information comes from John Walsh’s article, and I’ve adapted his format in presenting this information. His pitch types probably don’t correspond exactly to mine since he lumps sinkers and cutters in with four-seam fastballs and splitters in with changeups. I believe it’s still helpful to use his league-wide information for comparison since I haven’t established a league-wide baseline on my own yet.

With the four-seam fastball, Bedard mostly works the outside part of the plate, especially to lefties but also to righties. To lefties, he mostly stays up or away with the fastball, out of the strike zone, and when he does get in the zone, he doesn’t have very good results, although the sample size is small. Against righties, he gets very good results with the fastball, holding them to a .233 BABIP and a .419 slugging percentage.

With the cut fastball, Bedard works away from lefties and gets a lot of called strikes and not much good contact, although two cutters in the middle of the zone did go for home runs. Against righties, he’s all around the zone with the cut fastball, and his results aren’t quite as outstanding. He gets a few more foul balls and a lot less swinging strikes, but overall his results with the cutter are still pretty good against righties.

Erik Bedard threw one changeup to a lefty, Lyle Overbay, out of the 701 pitches in our data set, and that resulted in a fly ball out. To righties he works the changeup down and away, mostly out of the strike zone. When he gets it in the zone, they make contact. The changeup looks like Bedard’s weakest pitch.

Bedard throws the curveball down and away to lefties, and he generates a lot of swings with it–foul balls, swings and misses, and balls in play. Against righties he also works down and away but isn’t afraid to throw it in the zone. He gets a lot of swings and misses and when the ball is put in play, it’s hit weakly (.227 AVG and .318 SLG). The curveball is a great pitch for Bedard; no wonder he throws it so much.

I wanted to add a note at the end here about which pitches Bedard used to get his strikeouts. We have PITCHf/x data for 50 of his 221 strikeouts. Of those 50 K’s, 22 of them came on the fastball, 21 on the curveball, and 7 on the cutter. That lines up pretty well, percentage-wise, with his pitch mix with two strikes on the hitter.

Hopefully, we’ve learned a little about how Bedard dominated hitters in 2007–a strong fastball/cutter combo and an outstanding curveball. His changeup could use improvement, but it’s his fourth pitch, so that’s really a small complaint. It will be interesting to see if he can maintain the strong performance in 2008 as well as whether he will be doing so as part of the Orioles or on a different team.