Building on the previous pitch identification work I did for Eric Gagne, let’s take a look at how he uses his pitches.
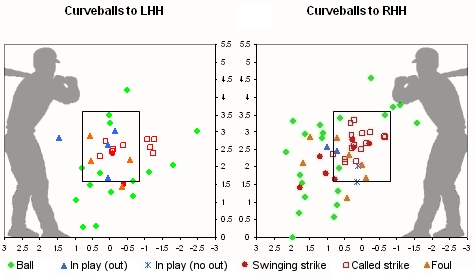
Here are some strike zone charts showing where he locates his pitches against left-handed hitters and right-handed hitters. I’m experimenting with the formatting of these charts, so let me know if there are things I can do to improve that. The graphics are a little small, but I thought it was more important to contrast the general patterns of lefty versus righty than to see the exact result for a specific pitch.
The strike zone is shown as a box, including one radius of a baseball on each side of the plate, and the top and bottom of the zone are a general average not adjusted per batter in these charts. The location is plotted where the pitch crossed the front of home plate.
Let’s begin with the curveball.
Gagne faces about an equal number of lefties and righties, so the first thing we can see is that he uses his curveball much more against righties (19% of pitches to RHH) than against lefties (11% of pitches to LHH).
He works away from righties and in to lefties with the curve and has pretty good success getting righties to chase the curve down and away.
Next, let’s look at fastballs.
Gagne throws approximately equal numbers of fastballs to lefties (56%) and righties (51%). He likes to work away to both lefties and righties but seems a little more willing to come inside to lefties. He gets a lot of foul balls and contact in the zone with his fastball and, other than a few high pitches, not a lot of balls chased out of the zone.
Moving on to changeups…
Gagne throws the changeup about equally to lefties (30%) and righties (25%). He clearly likes to keep his changeup down and away to both lefties and righties. It looks like he has pretty good success with that, but when he gets up in the zone with the change, it starts to get hit, particularly against lefties. We’ll see in a moment if the numbers bear that out, but the strike zone charts certainly look that way.
Finally, let’s look at the sliders.
Gagne doesn’t throw many sliders, 2% of pitches to lefties and 5% of pitches to righties. The few he throws to lefties are inside, same as with the curveball, perhaps moreso. With righties he works down and away with the slider, mostly missing the zone. It looks more like a show-me pitch than anything.
It would be interesting to learn on what count he throws the slider, or any of the other pitches for that matter, but I haven’t compiled that information yet.
Here are the results by pitch type and batter handedness in tabular format.
| LHH | Ball | CS | Foul | SS | IPO | IPNO | TB | BABIP | SLGBIP | Strk% |
| Fastball | 66 | 38 | 31 | 10 | 17 | 5 | 7 | 0.227 | 0.318 | 60% |
| Changeup | 31 | 10 | 12 | 17 | 9 | 11 | 13 | 0.550 | 0.650 | 66% |
| Curveball | 15 | 9 | 4 | 2 | 4 | 0 | 0 | 0.000 | 0.000 | 56% |
| Slider | 2 | 0 | 2 | 1 | 1 | 0 | 0 | 0.000 | 0.000 | 67% |
—
| RHH | Ball | CS | Foul | SS | IPO | IPNO | TB | BABIP | SLGBIP | Strk% |
| Fastball | 44 | 22 | 45 | 9 | 23 | 11 | 17 | 0.324 | 0.500 | 71% |
| Changeup | 28 | 8 | 14 | 17 | 6 | 3 | 6 | 0.333 | 0.667 | 63% |
| Curveball | 23 | 15 | 7 | 7 | 2 | 2 | 2 | 0.500 | 0.500 | 59% |
| Slider | 10 | 2 | 2 | 1 | 0 | 1 | 1 | 1.000 | 1.000 | 38% |
—
CS=called strike, SS=swinging strike, IPO=in play (out), IPNO=in play (no out), TB=total bases, BABIP=batting average on balls in play (including home runs), SLGBIP=slugging average on balls in play (including home runs). For Strk% all pitches other than balls are counted as strikes.
Clearly, my earlier hunch was right: Gagne’s changeup gets tattooed when he gets it up in the zone against lefties. Also, it does look like the slider is mainly a show-me pitch to righties.


October 5, 2007 at 8:11 am
Awesome article! Keep it up!
June 19, 2008 at 1:17 pm
eric gagne throw’s a fastball, change up , and a slurve. He doesn’t throw a slider or a curve. this was cool how you did this.